Charts To Watch : CRWD
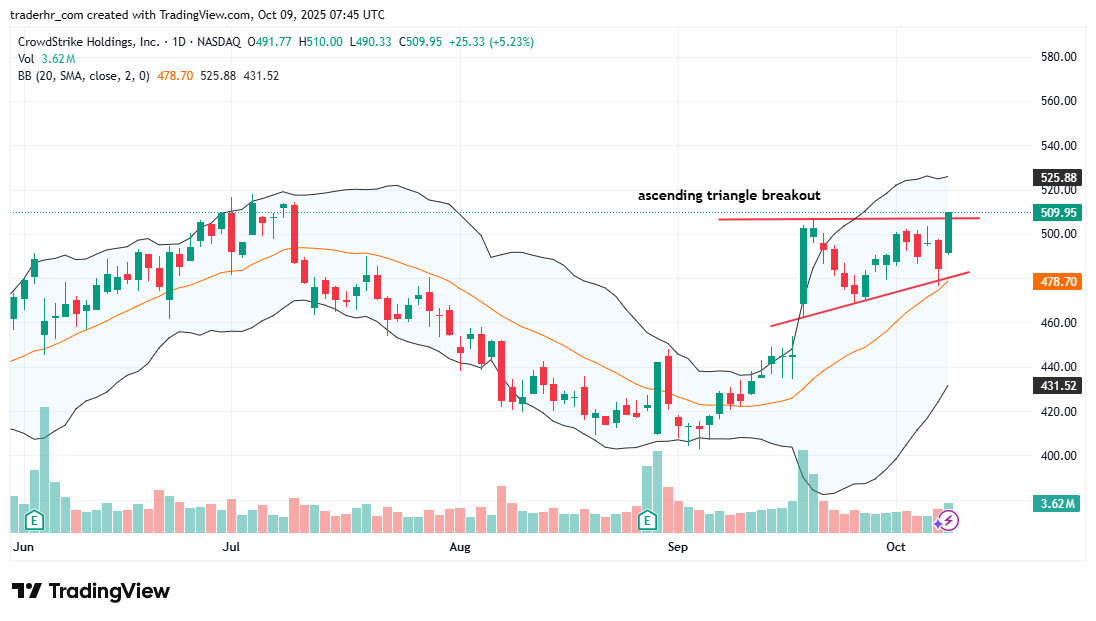
The chart for CrowdStrike Holdings, Inc. indicates a recent breakout from an ascending triangle pattern, suggesting a potential shift in momentum. The price is currently finding support near the lower trend line. The Bollinger Bands are expanding, indicating increased volatility, while recent volume spikes may suggest growing conviction in the price action. Traders should monitor for confirmation of bullish momentum above the breakout level, as well as any signs of retracement towards the underlying trend line for potential re-entry opportunities.
Charts To Watch – CRWD
Charts To Watch : CRWD Read More »