Charts To Watch

Charts To Watch

Charts to Watch: FDMT

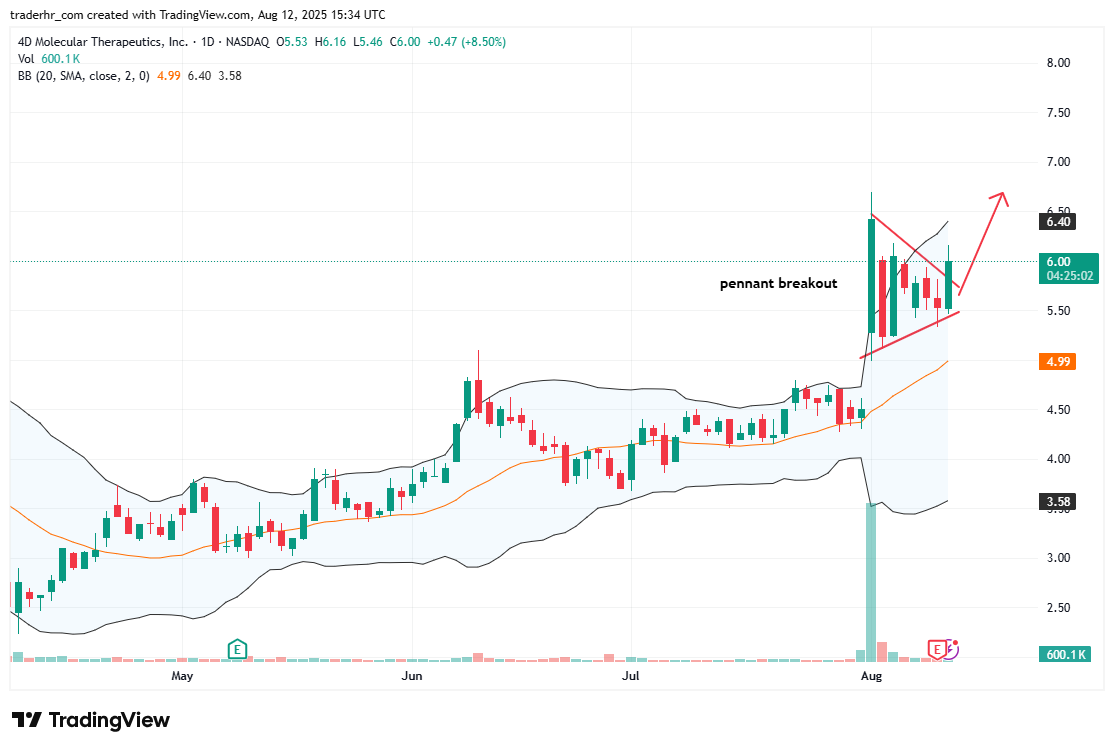
The chart displays a recent pennant formation, indicating a period of consolidation following upward momentum. A breakout from this pattern could signal further potential movement. The stock is currently trading within the Bollinger Bands, suggesting it may experience increased volatility. Volume appears to be picking up, which is often a precursor to significant price action. Observers should monitor for sustained moves beyond key resistance levels for potential trends.

MDGL chart

Charts to Watch – FDMT

Charts to Watch: FDMT Read More »

Charts to Watch: AAPL

The AAPL chart shows a recent period of tight consolidation after a notable uptrend. The price is currently positioned near a potential breakout level, with several consecutive green candles suggesting buying interest. The Bollinger Bands are narrowing, indicating reduced volatility which often precedes a price movement. It will be crucial to monitor volume trends as they can provide insights into market strength and direction in the upcoming sessions.

AAPL chart

Charts to Watch – AAPL

Charts to Watch: AAPL Read More »

Charts to Watch: SRDX

The stock chart for Surmodics shows a recent consolidation phase, with price movement stabilizing around the 38.00 level after a notable surge. The upper Bollinger Band indicates potential resistance at approximately 39.24, while the lower band at 34.24 suggests support. A breakout above recent highs may draw additional buying interest. Increasing volume during the latest price movements hints at strong investor engagement, making this chart one to watch closely.

SRMD chart

Charts to Watch – SRDX

Charts to Watch: SRDX Read More »

Charts to Watch: RGTI

The chart for Rigetti Computing displays a symmetrical triangle pattern, indicating potential consolidation. The price has approached the upper trendline, suggesting potential movement upon breakout. The Bollinger Bands are tightening, reflecting decreased volatility. The 20-day moving average is positioned above the 50-day moving average, which may indicate a bullish trend if the price maintains above these moving averages. Watch for increased volume as it could signal a continuation or reversal upon breakout.

RGTI chart

Charts to Watch – RGTI

Charts to Watch: RGTI Read More »

Scroll to Top