Charts to Watch: DXPE
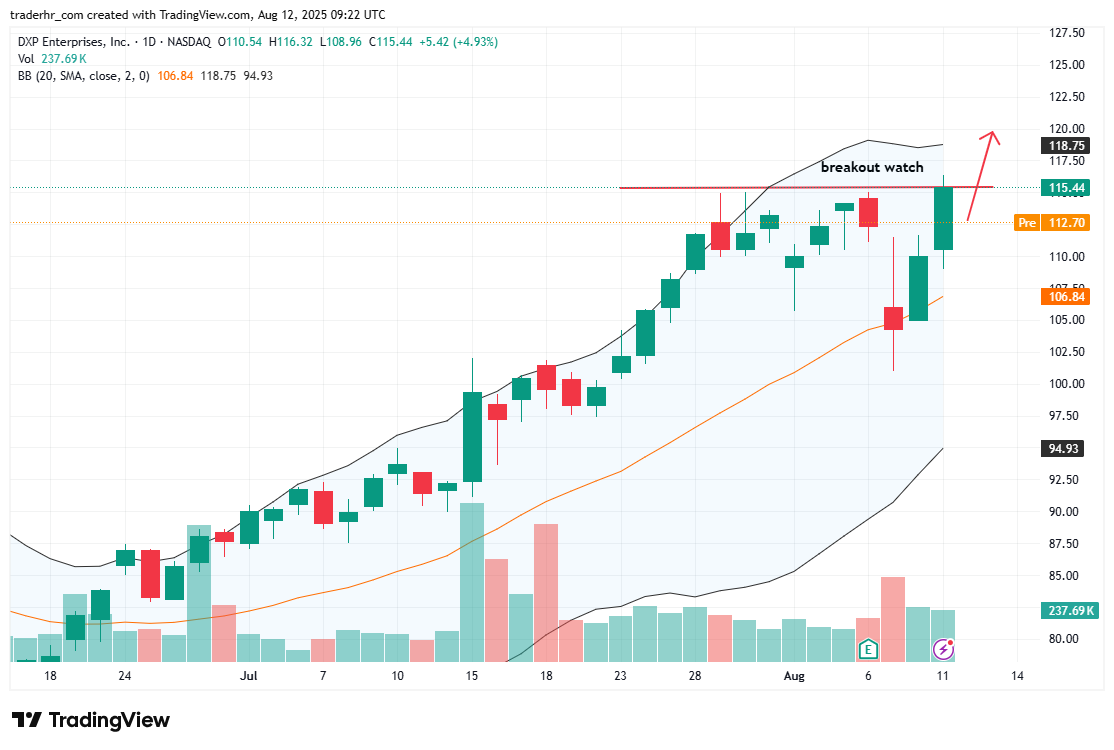
The chart indicates that DXP Enterprises is approaching a key breakout level around 115.44. Recent bullish momentum is supported by increasing volume, especially during upward movements. The Bollinger Bands are widening, suggesting enhanced volatility which may lead to significant price action. Price is currently above the 20-day SMA, indicating a potential bullish trend. Watching for confirmation at the breakout level will be crucial for further directional clarity.
Charts to Watch – DXPE
Charts to Watch: DXPE Read More »