Charts To Watch

Charts To Watch

Charts to Watch: AEO

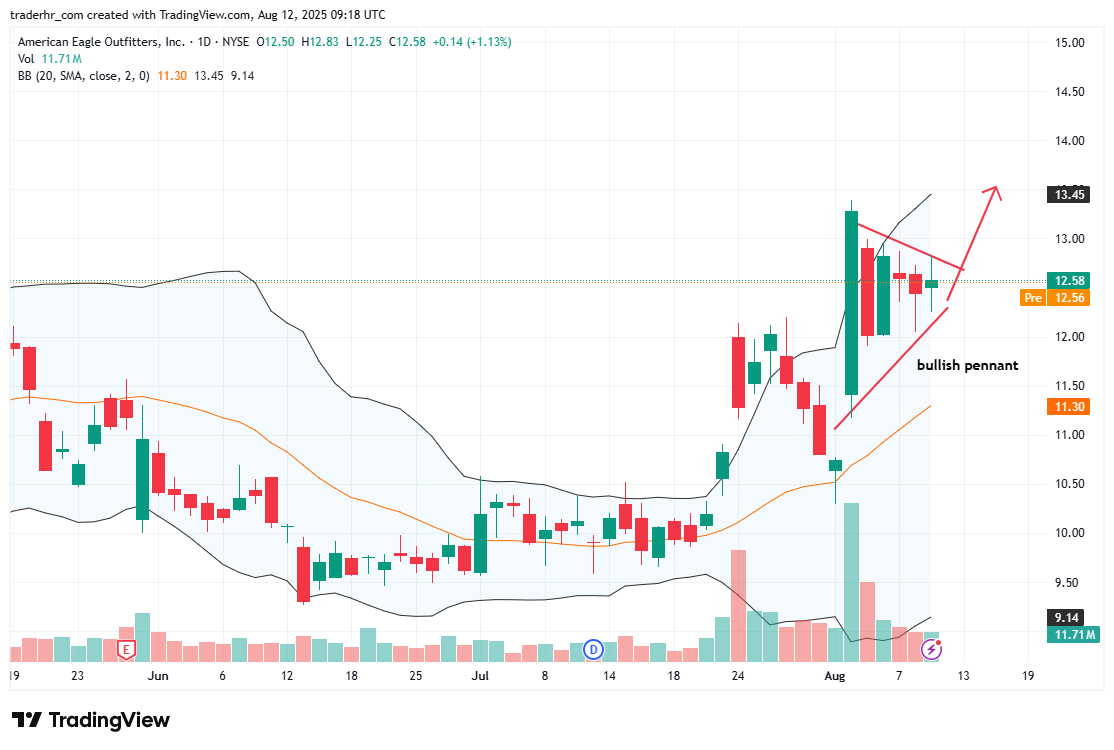
The recent chart for American Eagle Outfitters shows a bullish pennant formation, indicating potential upward momentum. The stock has been consolidating around the 12.50 to 12.60 range after a notable rally. The Bollinger Bands are tightening, which often suggests an impending breakout. Volume spiked during the upward movement, adding to the bullish sentiment. Monitoring price action near the apex of the pennant will be crucial for forecasting the next direction.

AEO chart

Charts to Watch – AEO

Charts to Watch: AEO Read More »

Charts to Watch: LVS

The chart for Las Vegas Sands displays a recent period of consolidation within a tight range, hovering above the 20-day moving average. The Bollinger Bands are narrowing, suggesting reduced volatility, potentially preceding a breakout. Volume has been relatively stable, indicating a lack of strong commitment from either buyers or sellers. The stock is approaching key resistance levels, and the interplay between upward and downward price movements will be crucial in determining the next directional move.

LVS chart

Charts to Watch – LVS

Charts to Watch: LVS Read More »

Charts to Watch: GM

The stock shows a recent bullish trend with increasing price action and volume, particularly evident in the last few weeks. The price has been testing resistance around the $54 mark, indicating potential for further movement. The Bollinger Bands suggest that volatility may be increasing, which could lead to significant price fluctuations. The 50-day simple moving average is acting as a support level, which may provide additional bullish sentiment if the price remains above it.

GM chart

Charts to Watch – GM

Charts to Watch: GM Read More »

Charts to Watch: GD

The chart displays General Dynamics Corporation in a defined upward trend, with prices consistently above the 20-day simple moving average. A triangular consolidation pattern is emerging, suggesting potential volatility in the near term. The Bollinger Bands indicate a period of low volatility, while recent price action shows attempts to break above previous resistance levels. Volume appears to be expanding, which may support upward momentum if a breakout occurs.

GD chart

Charts to Watch – GD

Charts to Watch: GD Read More »

Scroll to Top