Charts to Watch: SPY
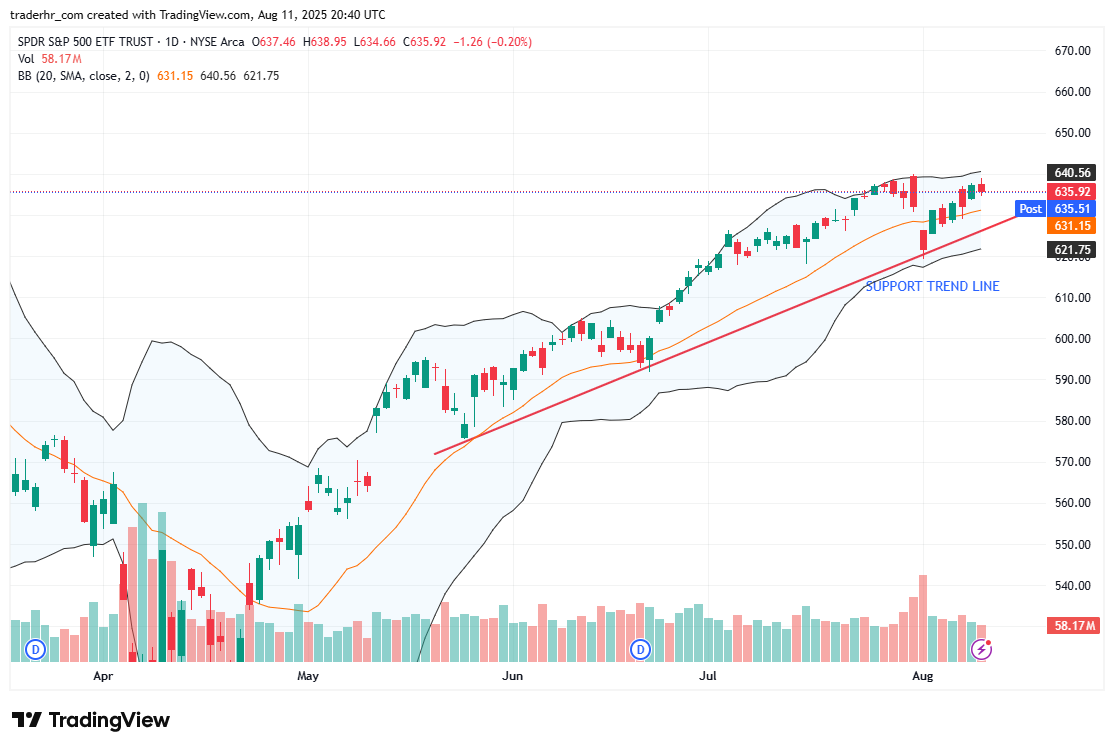
The SPY chart displays a recent consolidation pattern, with the price hovering near the upper Bollinger Band and showing signs of resistance. The support trend line is intact, suggesting potential upward momentum if maintained. Volume has been notably higher during price pullbacks, indicating increased investor interest. Traders should monitor for breakout signals alongside potential retracement towards the support level, as any significant shift could dictate the stock’s next movement.
Charts to Watch – SPY
Charts to Watch: SPY Read More »