Charts To Watch : IONQ
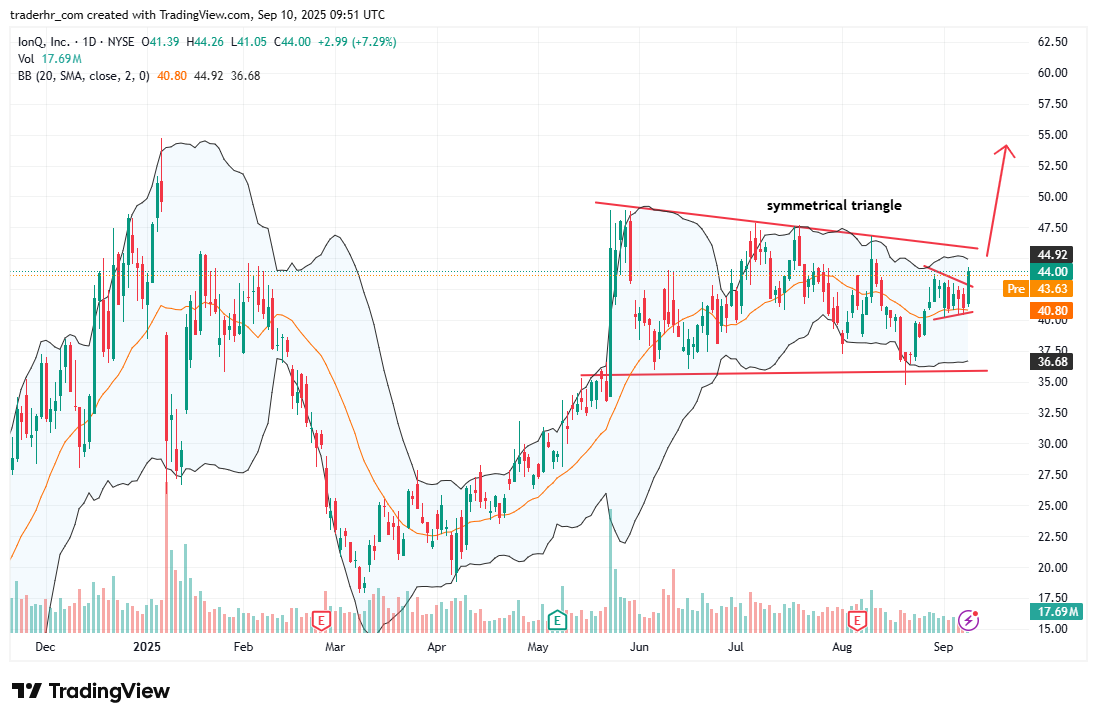
The chart displays a developing symmetrical triangle pattern, indicating a period of consolidation in price. The stock has been oscillating between horizontal resistance near the high 44s and support around the 40s. Moving averages suggest a compressed range, with recent fluctuations showing decreased volatility. A breakout from this triangle could signal a new direction. The Bollinger Bands also reflect this contraction, highlighting tightening price action that may precede significant movement.
Charts To Watch – IONQ
Charts To Watch : IONQ Read More »