Charts To Watch

Charts To Watch

Charts To Watch : AMZN

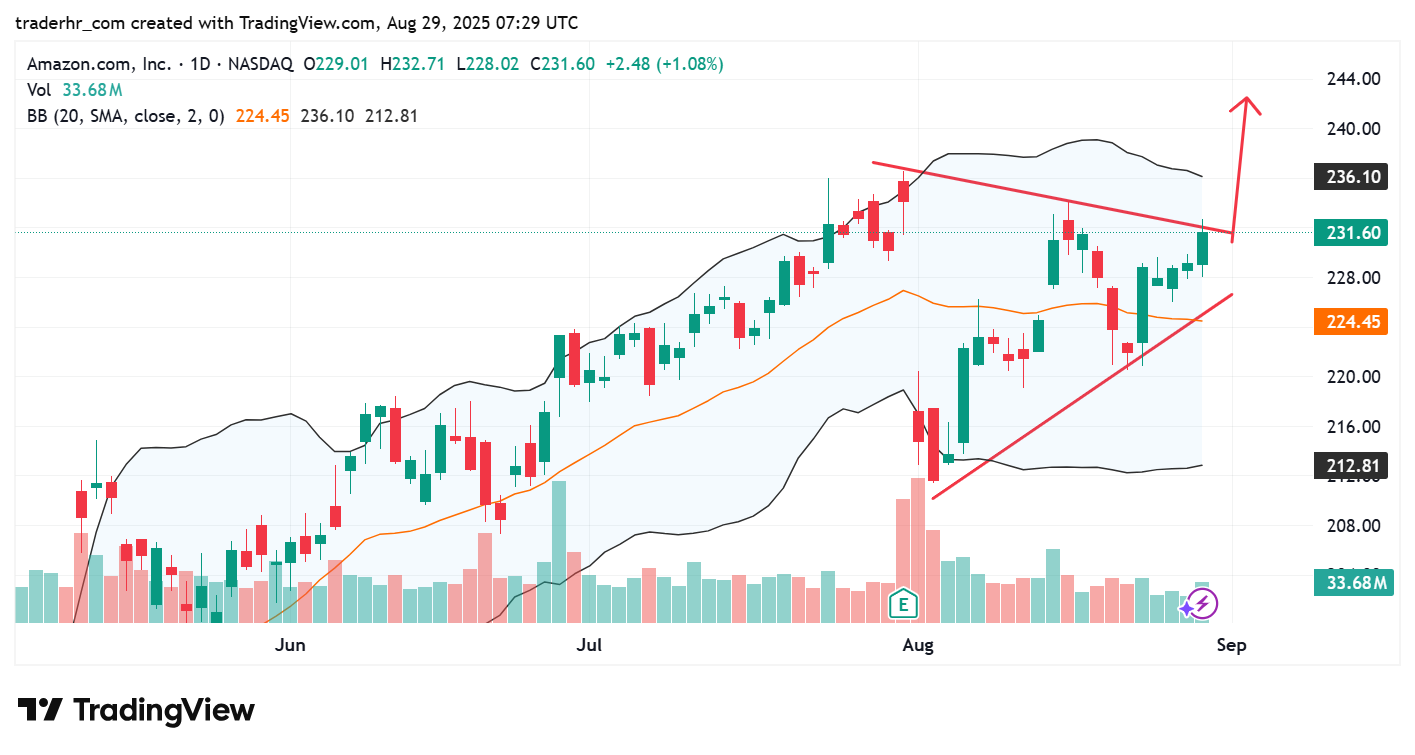
The chart shows Amazon, Inc. forming a bullish ascending triangle pattern, suggesting potential upward movement. Recent price action has tested the upper boundary, indicating increased buying interest. The Bollinger Bands are widening, reflecting potential volatility. The 20-day moving average appears to provide support, while volume has been relatively strong, adding to the bullish sentiment. A break above the resistance level could signal further gains.

AMZN chart

Charts To Watch – AMZN

Charts To Watch : AMZN Read More »

Charts To Watch : MHK

The chart for Mohawk Industries shows a strong upward trend with recent consolidation around the 132 level. The price is currently testing resistance at 136.11, suggesting a potential for breakout or reversal. The volume trend indicates increased interest, particularly with recent green candles. The moving averages provide support, with the 20-day MA positioned below current prices, enhancing bullish sentiment. Investors should monitor the price action near the resistance level for potential trading opportunities.

MHK chart

Charts To Watch – MHK

Charts To Watch : MHK Read More »

Charts To Watch : DAL

The chart highlights a recent upward trend in Delta Air Lines, with a strong move towards resistance around the recent highs. The price is making higher lows, supported by the rising 50-day moving average. Bollinger Bands indicate potential volatility, as the price approaches the upper band. Watch for potential breakout patterns as the stock nears the resistance level, while the volume shows considerable interest. A healthy consolidation period might precede further directional moves.

DAL chart

Charts To Watch – DAL

Charts To Watch : DAL Read More »

Charts To Watch : WYNN

The chart shows Wynn Resorts consolidating in a narrowing range, evident from the upward sloping trendlines. The recent price action indicates a potential breakout as it approaches the upper trendline. Increased volume accompanying the latest gains suggests heightened interest, while the Bollinger Bands are also tightening, indicating reduced volatility. Momentum indicators appear supportive of upward movement. Observing how the stock reacts at this critical resistance could provide clues for future direction.

WYNN chart

Charts To Watch – WYNN

Charts To Watch : WYNN Read More »

Scroll to Top