Charts To Watch

Charts To Watch

Charts To Watch : SWK

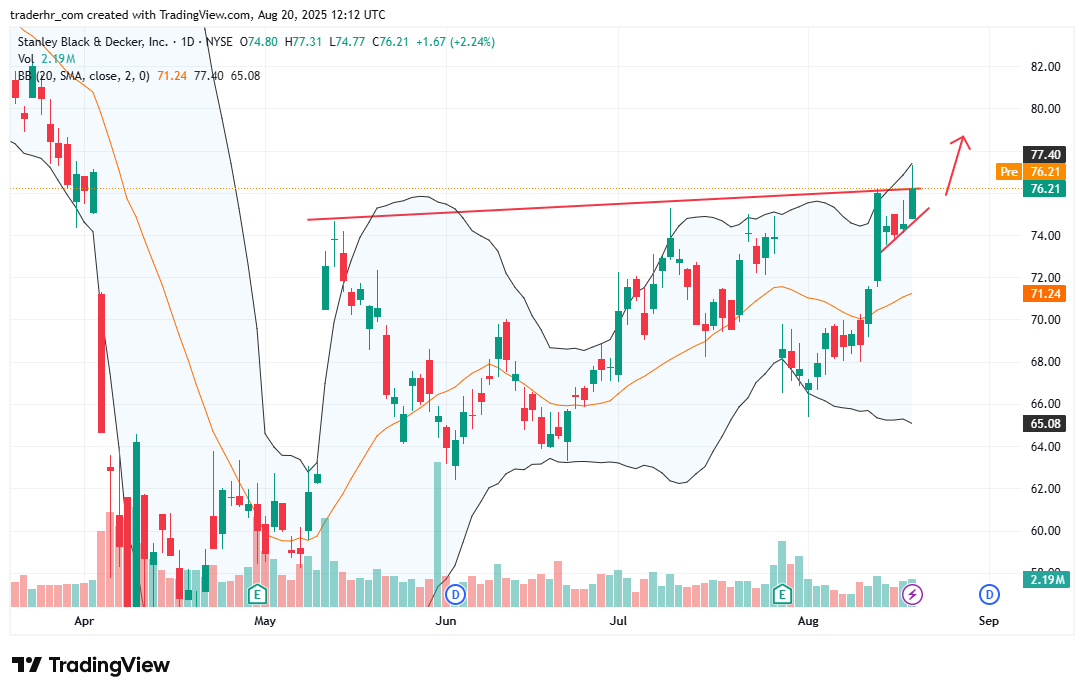
The stock shows a clear upward trend, recently breaking above a resistance line drawn from previous highs. The support from the 20-day moving average indicates potential bullish momentum. The Bollinger Bands are widening, which suggests increasing volatility. Notably, the recent trading volume appears higher, which could signify stronger investor interest. Watch for continued price action around the recent highs as it tests resistance levels.

SWK chart

Charts To Watch – SWK

Charts To Watch : SWK Read More »

Charts To Watch : LIND

The stock has recently approached a resistance level around the 13.50 area, with bullish momentum noted in the latest candles. The Bollinger Bands suggest potential for volatility, as the price is currently testing the upper band. AMACD crossover indicates positive sentiment, while volume spikes could signify strong interest from traders. Should the price surpass the current resistance, it may open the door for further upward movement. Key support is established around the 12.59 mark, indicating a potential range to watch.

LIND chart

Charts To Watch – LIND

Charts To Watch : LIND Read More »

Charts To Watch : PTGX

The stock exhibits a period of consolidation within a defined range, indicated by horizontal resistance around the mid-50s and an ascending trendline below. Recent price action shows a bounce off the lower boundary, suggesting potential upward momentum. The Bollinger Bands are narrowing, indicating a period of low volatility, which may precede a breakout. Volume appears to be increasing as the stock approaches the resistance level, indicating growing interest. Traders should watch for a confirmed move beyond the resistance to gauge the next direction.

PTGX chart

Charts To Watch – PTGX

Charts To Watch : PTGX Read More »

Charts To Watch : OLEA

The chart displays a series of upward movements in price, particularly noticeable in the last few months. The stock has recently crossed above the moving average, suggesting strengthening momentum. Bollinger Bands indicate potential volatility, with the price nearing the upper band. Volume trends show increased participation in the most recent moves, reinforcing the current bullish sentiment. Observing how the price behaves around the recent peak may provide insights into potential continuation or correction patterns.

OLEA chart

Charts To Watch – OLEA

Charts To Watch : OLEA Read More »

Scroll to Top