Charts To Watch

Charts To Watch

Charts To Watch : IART

The chart indicates a notable recovery since May, with prices forming a series of higher lows and nearing a potential reversal point. Recently, the price has approached a crucial resistance level, hinting at possible breakout momentum. Volume appears supportive of this upward trend, suggesting increased investor interest. Watch for confirmation of a breakout as the price interacts with this resistance area, which could provide insights into the stock’s short-term trajectory.

IART chart

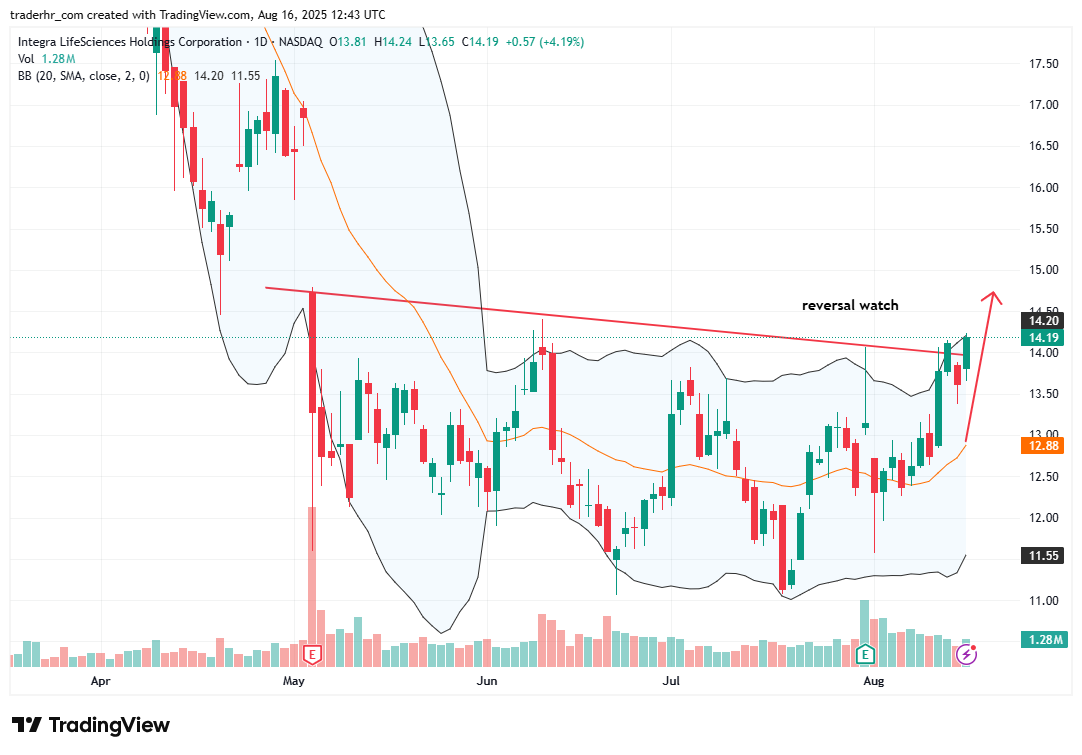
Charts To Watch – IART

Charts To Watch : IART Read More »

Charts To Watch : EHAB

The chart shows a pennant formation, indicating potential price consolidation. The stock has recently bounced off support near the lower Bollinger Band while approaching the upper band, suggesting increased volatility. Volume trends appear moderate, reflecting cautious interest. Key moving averages are converging, which may signify an upcoming directional movement. Traders should monitor closely for any breakout or breakdown, as this pattern often precedes significant price action.

ENVB chart

Charts To Watch – EHAB

Charts To Watch : EHAB Read More »

Charts To Watch : CDTX

The chart shows a recent upward trend with the price testing resistance around the upper Bollinger Band. Following a consolidation phase, the stock appears to regain momentum, supported by a rising 20-day moving average. Volume has been relatively steady, hinting at sustained interest. The proximity to previous resistance suggests potential for further movement if momentum continues. Overall, the stock may experience increased volatility as it approaches key price levels.

CDTX chart

Charts To Watch – CDTX

Charts To Watch : CDTX Read More »

Charts To Watch : AMCX

The chart for AMC Networks displays a recent upward trend characterized by a series of higher lows and an emerging bullish wedge pattern. The Bollinger Bands indicate a period of consolidation with decreasing volatility, suggesting potential for a breakout. The most recent price action shows a recovery towards the upper band, which may signal continued upward momentum if buying interest persists. Volume trends appear supportive of this potential move, warranting close monitoring.

AMC chart

Charts To Watch – AMCX

Charts To Watch : AMCX Read More »

Scroll to Top