Charts To Watch

Charts To Watch

Charts To Watch : AAL

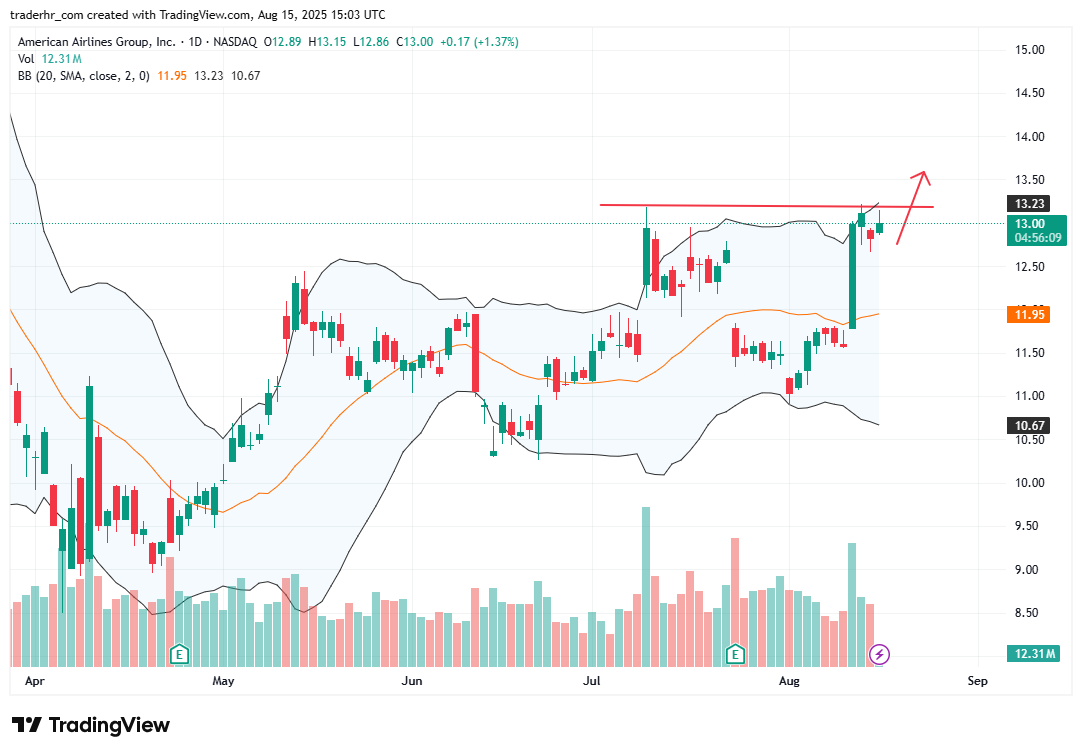
The chart for American Airlines shows a recent breakout attempt approaching resistance around 13.00. The price is currently trading near this level, with volume spikes indicating increased interest. The Bollinger Bands are converging, suggesting potential volatility ahead. If momentum continues, a sustained break above the resistance could lead to further upside. Conversely, a failure to hold this level may lead to a pullback towards the 11.95 support area, which has previously acted as a floor.

AAL chart

Charts To Watch – AAL

Charts To Watch : AAL Read More »

Charts To Watch : MDT

The chart shows a recent consolidation phase for Medtronic, indicating potential indecision in the market. A notable breakout level is observed near 94.01, with the stock potentially poised to test this resistance. The Bollinger Bands are tightening, suggesting reduced volatility, which often precedes significant price movements. The upward trend in the moving average could provide underlying support. Volume has been relatively stable, signaling cautious interest as the stock approaches key levels.

MDT chart

Charts To Watch – MDT

Charts To Watch : MDT Read More »

Charts To Watch : AMZN

The chart shows Amazon.com, Inc. trending in an upward channel since May. Recent price action indicates a clear bounce off the lower Bollinger Band, with the price moving back towards the upper band. The volume trend is supportive, particularly with the recent surge, suggesting heightened interest. The 20-day SMA is also trending upwards, reinforcing the bullish sentiment. The next key observation will be whether the price can maintain momentum and break through resistance near the upper channel line.

AMZN chart

Charts To Watch – AMZN

Charts To Watch : AMZN Read More »

Charts To Watch : MCO

The chart displays a recent upward trend in the stock, supported by a steady rise along an ascending trendline. The stock is currently nearing a resistance level, indicated by the horizontal line around 525. The Bollinger Bands show the stock is trading within a tighter range, suggesting potential volatility. Volume has seen fluctuations but remains consistent, which may indicate increased interest. A breakout above the resistance could signal further upward momentum, while a reversal might see support tested near 511.

MCO chart

Charts To Watch – MCO

Charts To Watch : MCO Read More »

Scroll to Top