Charts To Watch

Charts To Watch

Charts To Watch : WBA

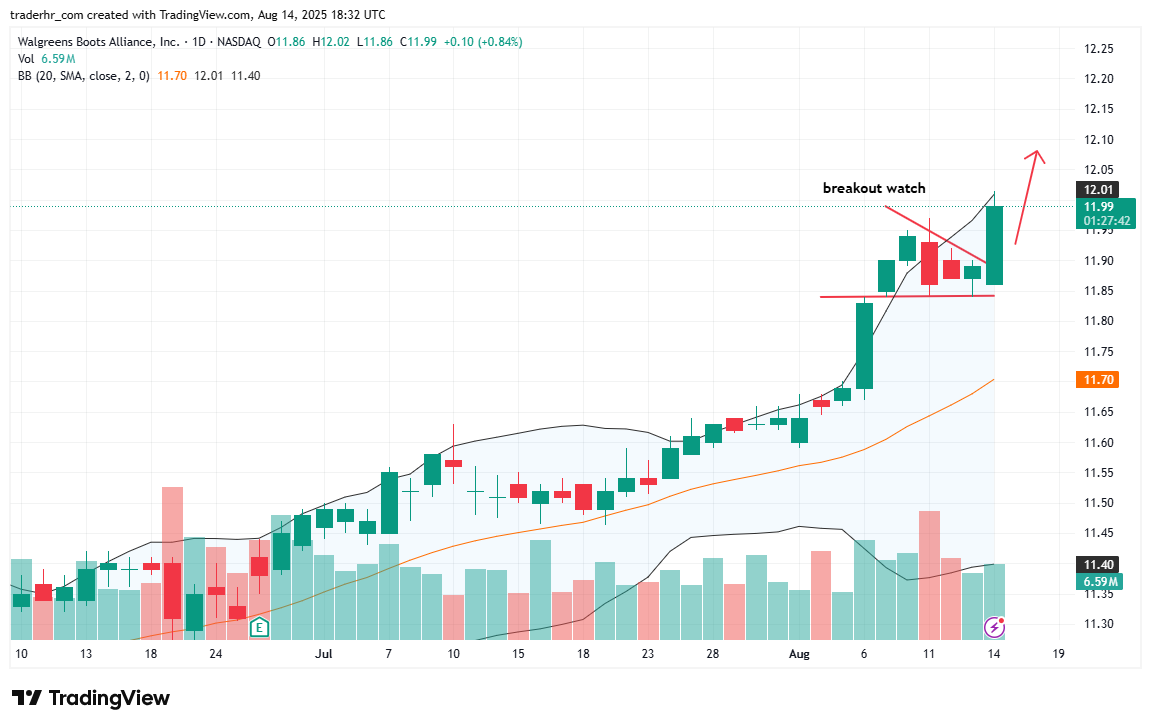
The chart indicates a potential breakout as the stock approaches a resistance level near 12.00. Recent price action shows a series of higher lows, suggesting bullish momentum. The volume appears supportive of this uptrend, and the Bollinger Bands are widening, indicating increased volatility. The 20-day moving average seems to provide a dynamic support level, reinforcing the potential for further upside if the resistance is breached.

WBA chart

Charts To Watch – WBA

Charts To Watch : WBA Read More »

Charts To Watch : IART

The chart for Integra LifeSciences shows a notable consolidation phase, with price action fluctuating within a defined range around the $12.50 level. A recent upward movement has brought the price near the trendline resistance, which if breached, may signify a bullish reversal. The Bollinger Bands are expanding, indicating increasing volatility. Volume patterns suggest heightened activity, particularly around key levels, which could support a potential breakout. Monitoring the resistance at $13.80 will be essential for identifying further direction.

IART chart

Charts To Watch – IART

Charts To Watch : IART Read More »

Charts To Watch : MPWR

The chart shows a notable pennant breakout, indicating potential upward momentum. A significant increase in volume coinciding with this breakout reinforces the bullish sentiment. The price has successfully moved above both the 20-day moving average and the upper Bollinger Band, suggesting further strength in the rally. However, observing for possible pullbacks or consolidation phases is essential, as the market dynamics can change rapidly. Overall, the technical indicators point towards a continuation of the upward trend in the short term.

MPWR chart

Charts To Watch – MPWR

Charts To Watch : MPWR Read More »

Charts To Watch : AMD

The chart shows a recent narrowing range for Advanced Micro Devices (AMD), indicating potential consolidation. The price is approaching a breakout level, with volume remaining significantly noticeable, suggesting increased interest. The Bollinger Bands are tightening, which may signal an impending price movement. The price is currently above the key moving averages, supporting a bullish outlook. Traders should monitor the breakout point for potential entry opportunities.

AMD chart

Charts To Watch – AMD

Charts To Watch : AMD Read More »

Scroll to Top