Charts To Watch : TSLA
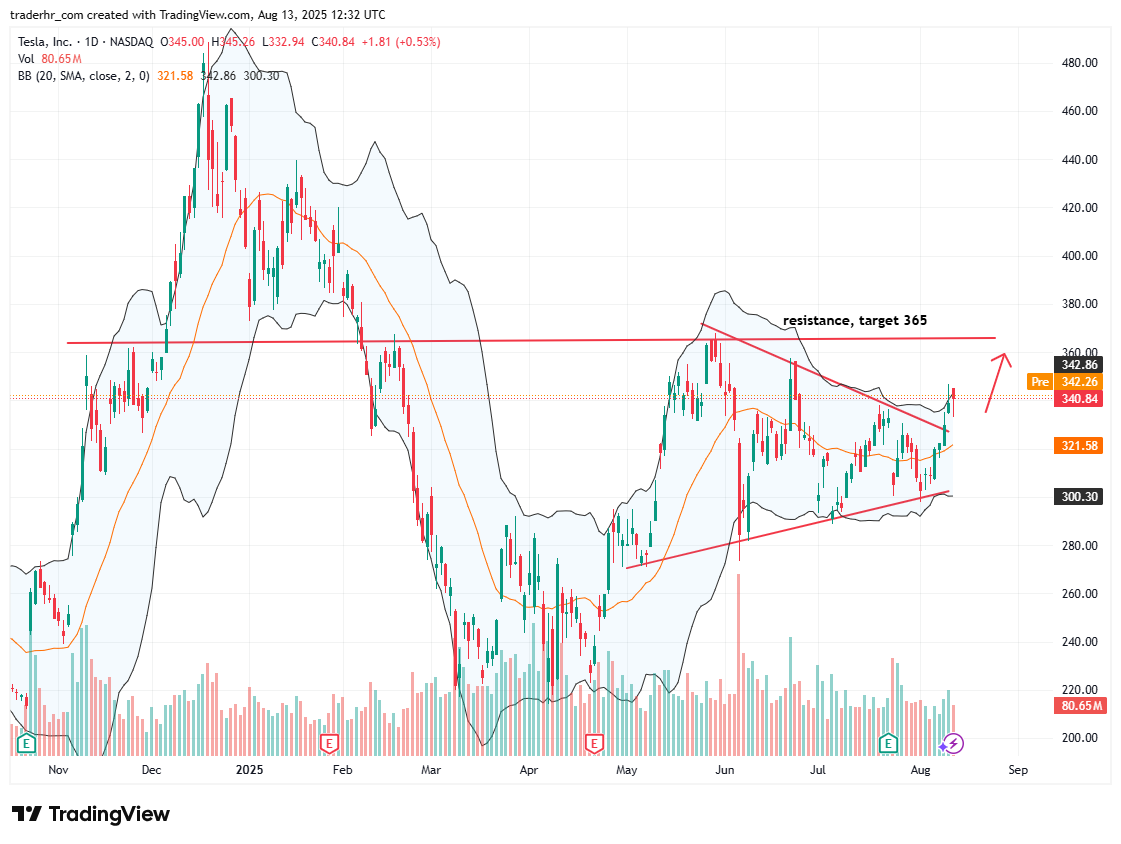
The stock appears to be forming a symmetrical triangle pattern, suggesting consolidation before a potential breakout. Recent trading has approached a resistance level, which could indicate upward pressure if breached. Bollinger Bands are tightening, pointing to decreasing volatility, which often precedes significant price movement. Volume trends show some accumulation, but further confirmation of direction will be essential as the stock approaches the resistance threshold. Observing upcoming trading activity will be crucial for assessing the next potential movement.
Charts To Watch – TSLA
Charts To Watch : TSLA Read More »