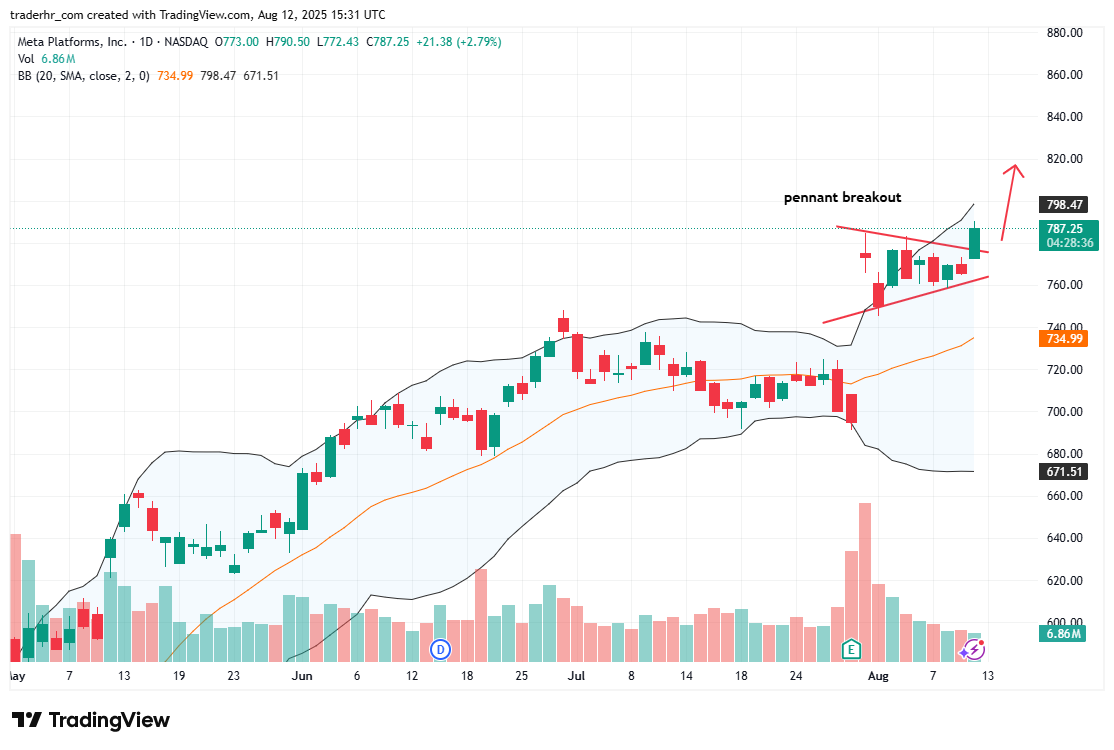
Charts To Watch : DVN
The chart for Devon Energy (DVN) displays a recent breakout from a triangle pattern, indicating a potential shift in momentum. Price movements have recently approached the upper Bollinger Band, suggesting increased volatility. Volume has notably picked up, which may support future price movements. Key moving averages are converging, indicating potential directional changes. Market participants should monitor for continuation patterns or retracement back toward the lower band for further trading opportunities.
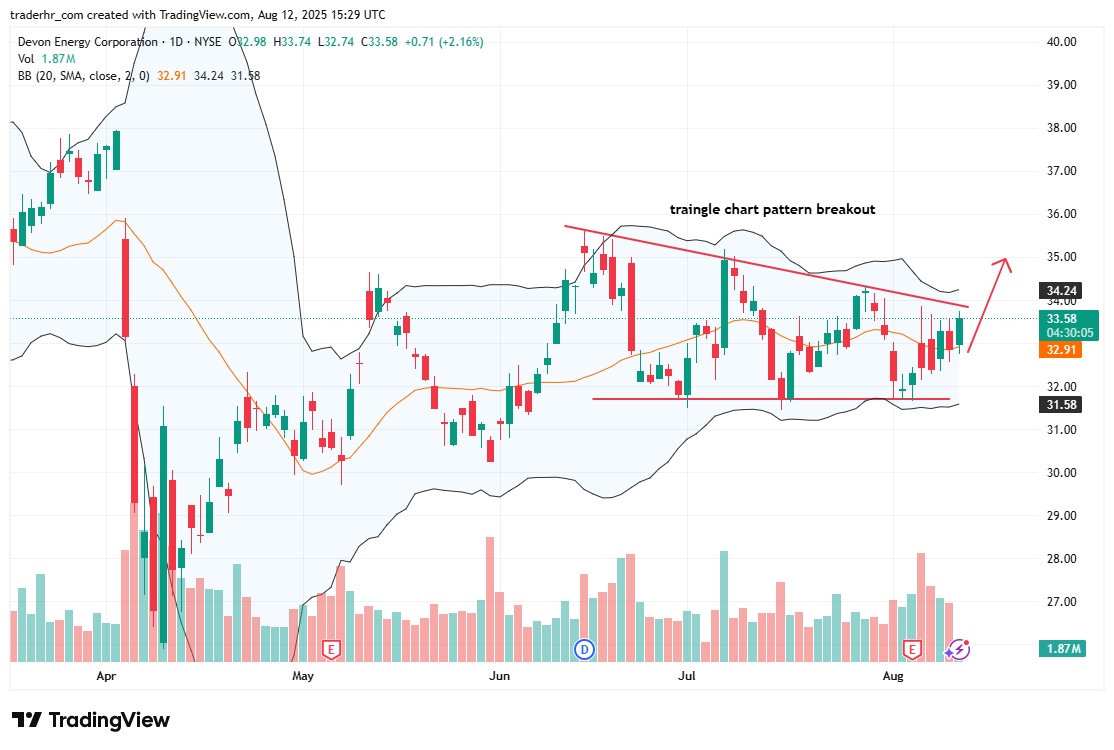
Charts To Watch – DVN
Charts To Watch : DVN Read More »