Free Watch List

Free Watch List for Jul 29, 2025

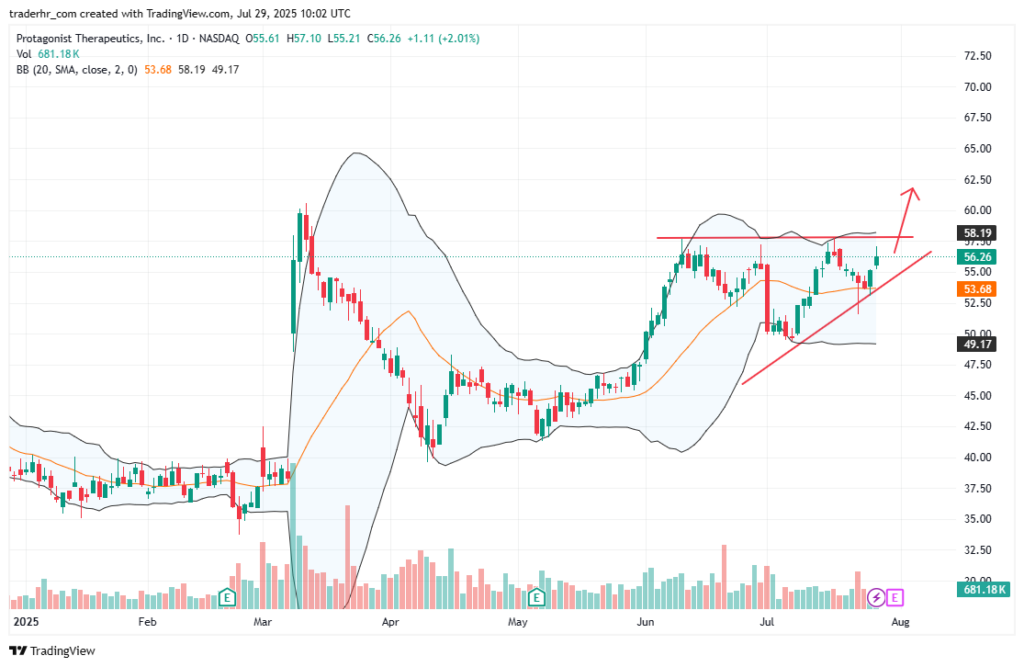
$PTGX: Price is forming an ascending triangle with buyers stepping in at higher levels. The flat resistance near the top suggests a breakout could be imminent. A close above resistance on strong volume would confirm bullish continuation. Trend remains intact while price respects the rising support line.
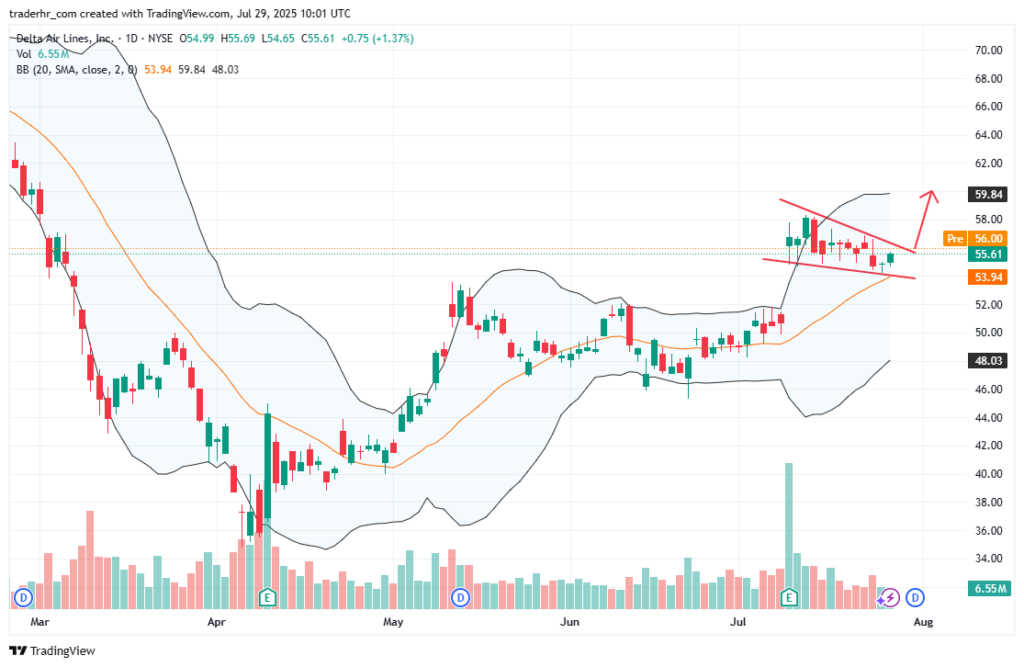
$DAL:  A falling wedge pattern is forming after a strong upward move, suggesting consolidation before a possible breakout. The narrowing price action with lower highs and lower lows signals declining selling pressure. A breakout above the wedge could trigger renewed bullish momentum, especially with volume confirmation.
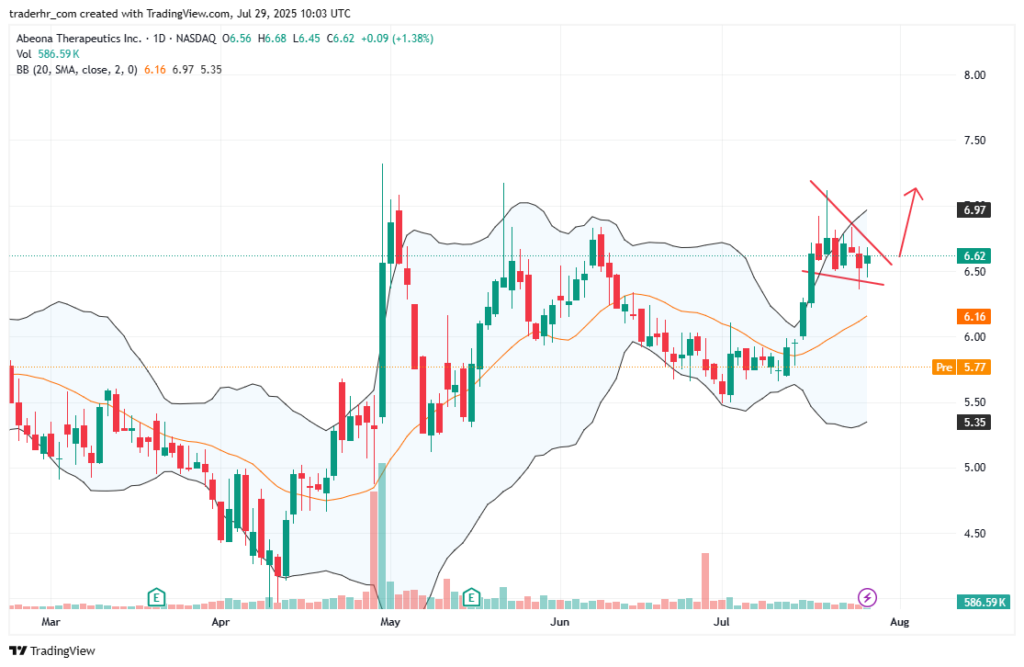
ABEO: A bullish flag is forming after a strong price surge. The tight, downward-sloping consolidation suggests healthy profit-taking within an overall uptrend. A breakout above the flag’s upper trendline could signal continuation toward higher levels. Volume confirmation will strengthen the breakout case.

Unlock the Premium Trade Alerts with a Full Trading Plan in the Members Area.

Discount code: OFF25 for -25% expires in...

Free Watch List for Jul 29, 2025 Read More »

Free Watch List for Jul 17, 2025

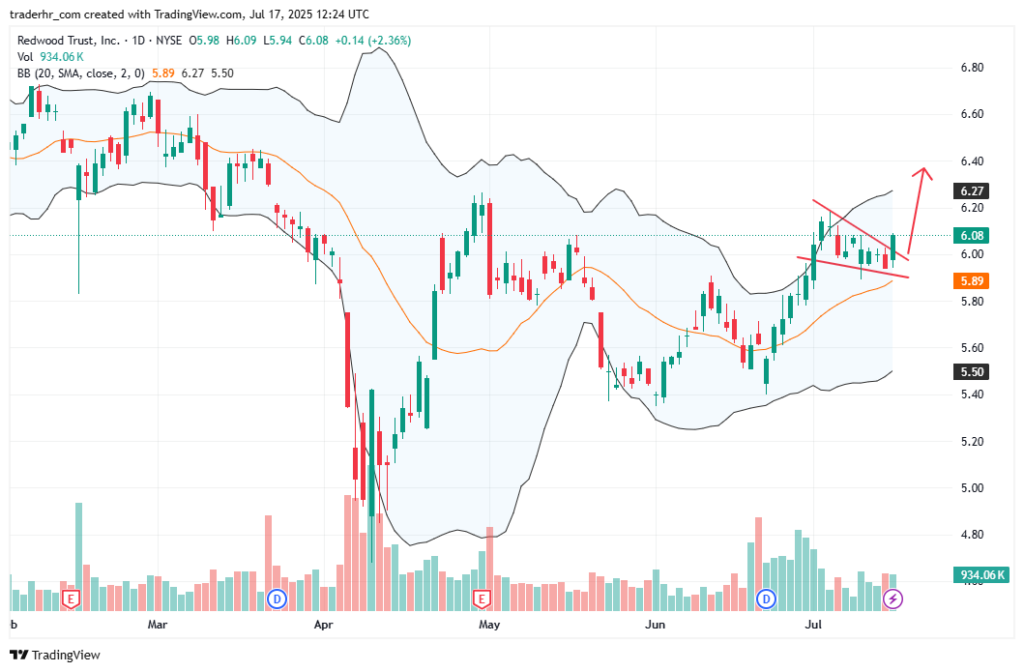
$RWT A bullish pennant is forming after a sharp rally, with price consolidating in a tight range. The breakout above the upper trendline signals bullish continuation potential. Volume should be monitored closely — a spike could confirm the breakout strength. Momentum favors a move higher as long as support holds.
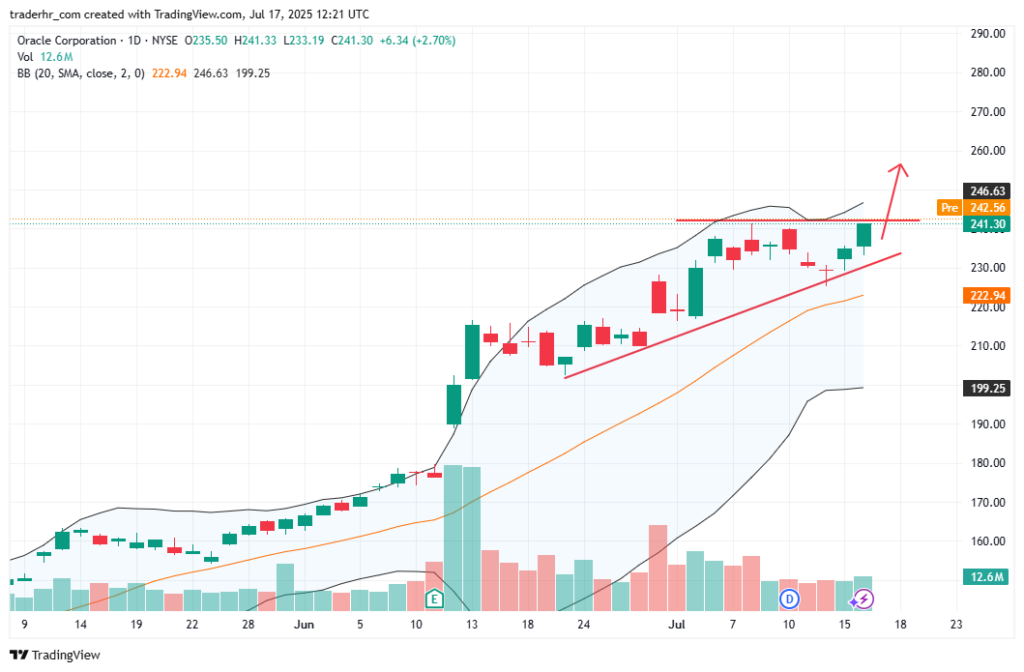
$ORCL Price is pressing against key resistance within an ascending triangle. Higher lows reflect building buying pressure. A breakout above resistance with increased volume could spark the next leg higher. The bullish trend remains intact while price stays above the rising support line.
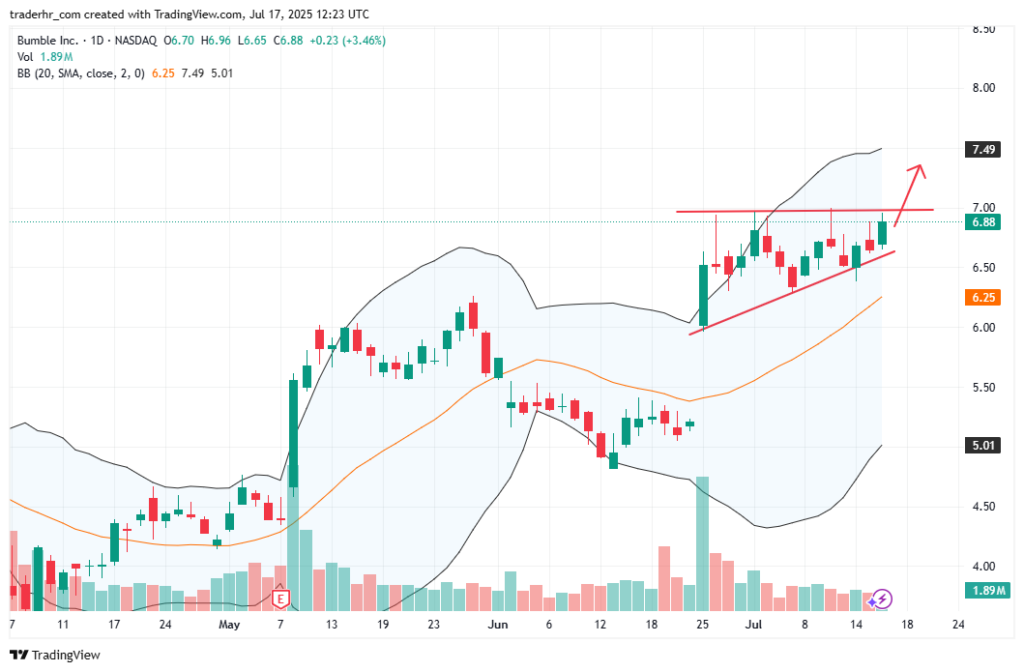
$BMBL An ascending triangle is forming with higher lows pressing against a flat resistance level. This signals strong accumulation and potential for a breakout. A close above resistance with rising volume would confirm the move. Momentum remains bullish as long as the trendline support holds.
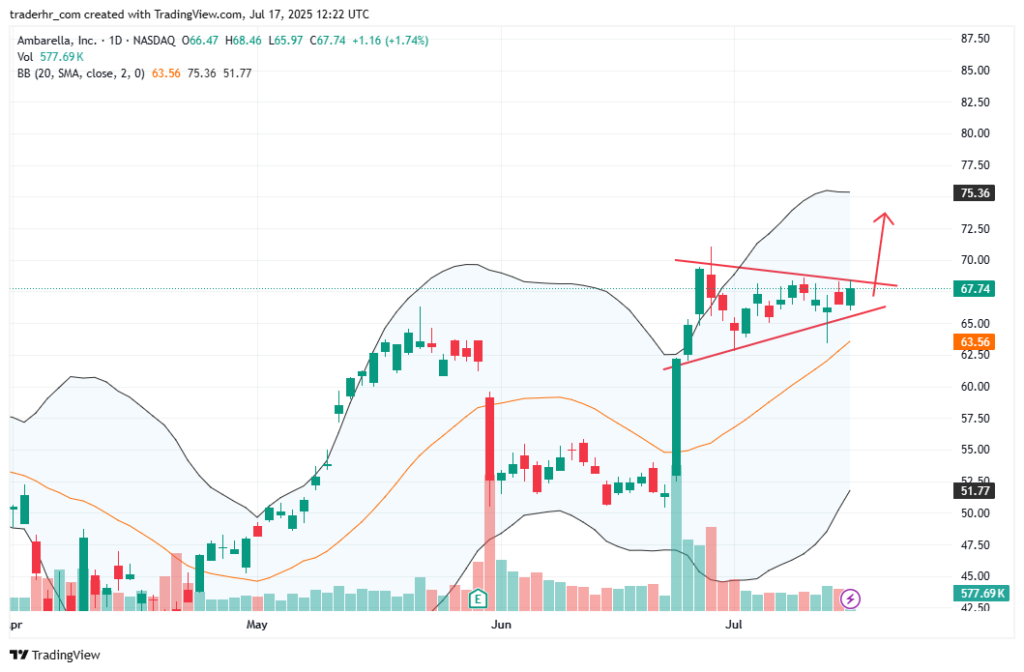
$AMBA Price is consolidating in a symmetrical triangle following a strong gap-up, indicating a potential bullish continuation. Higher lows and tightening range suggest buyers are gaining control. A breakout above the upper trendline could trigger strong upside momentum. Watch for volume confirmation

Unlock the Premium Trade Alerts with a Full Trading Plan in the Members Area.

Discount code: OFF25 for -25% expires in...

Free Watch List for Jul 17, 2025 Read More »

Free Watch List for Jul 15 2025

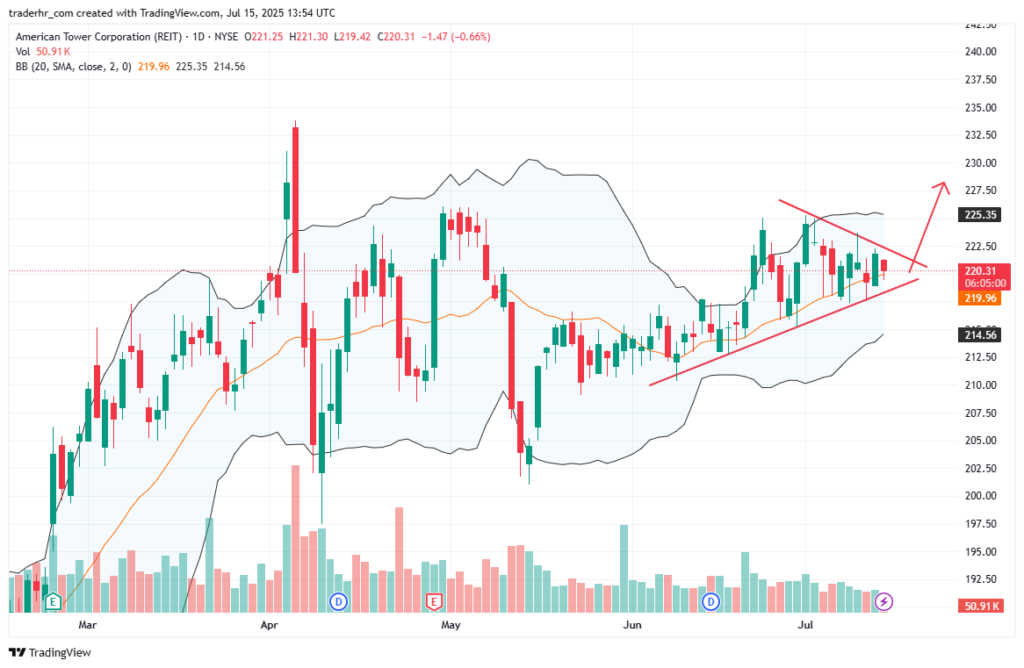
$AMT shows a symmetrical triangle forming within an uptrend, suggesting potential for a bullish breakout. Price is consolidating between rising support and descending resistance, with decreasing volume—typical before a breakout. A strong move above the upper trendline, especially on increased volume, could signal trend continuation. Traders may look for confirmation before entering, with risk managed below support.
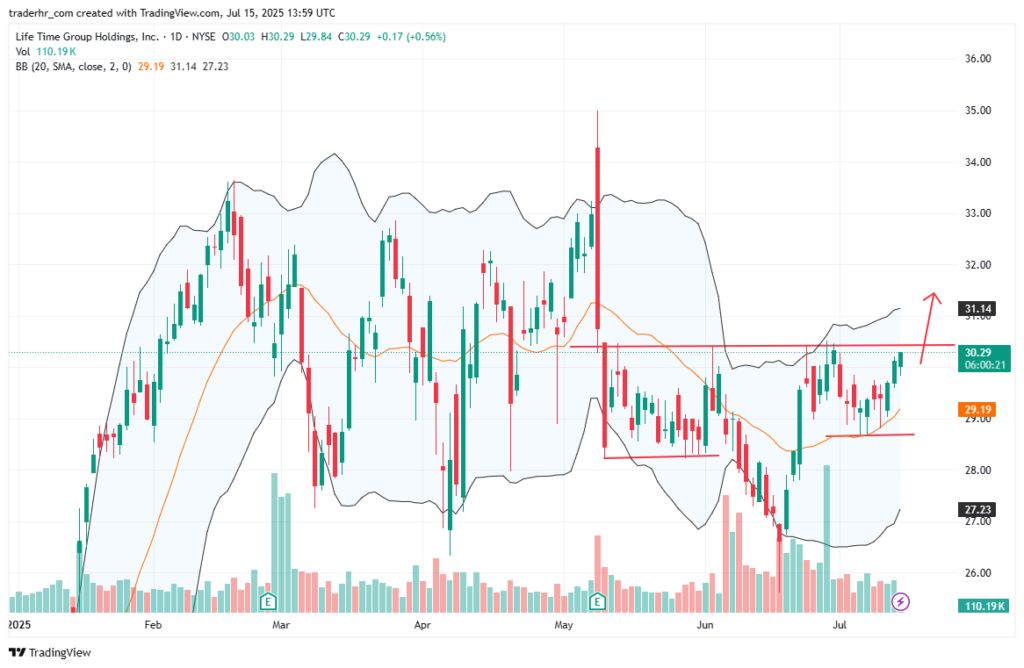
$LTH shows a clear horizontal resistance level being tested after a period of consolidation. The price has formed a base with higher lows, indicating growing buying pressure. A breakout above the marked resistance zone could trigger a bullish continuation. Volume is picking up, which supports the potential for a strong move if the price closes above resistance. Watching for confirmation and sustained momentum is key
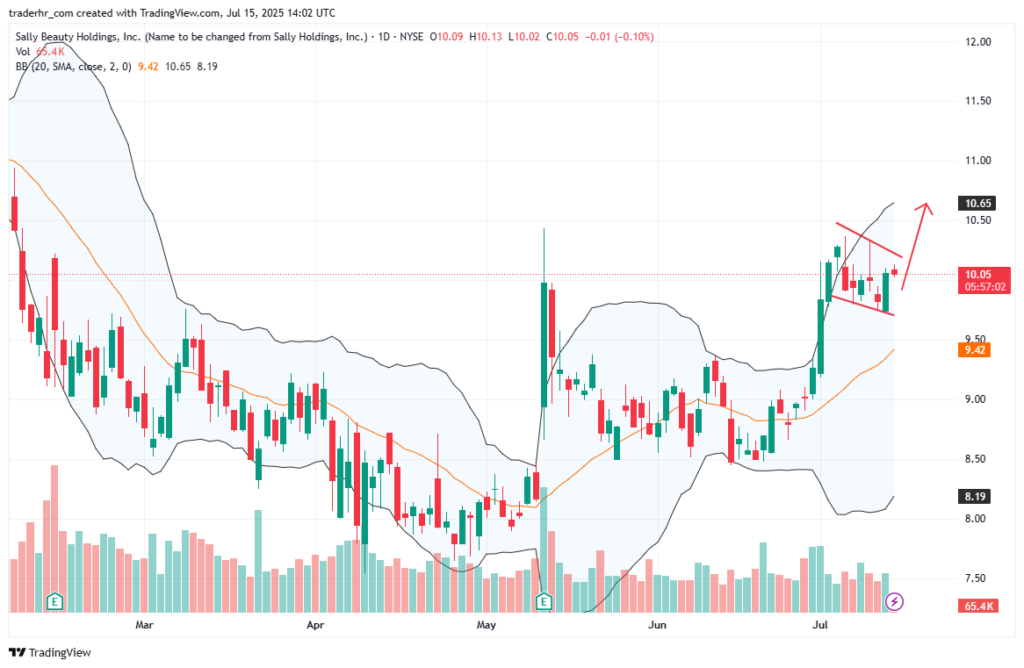
$SBH displays a bullish flag pattern forming after a strong upward impulse. The price is consolidating within a narrow downward-sloping channel, typical of a continuation setup. Such patterns often resolve with a breakout in the direction of the prior trend. If volume increases on a move above the upper trendline, it may confirm a resumption of the rally. The overall structure favors bulls, with momentum still intact pending confirmation.

Unlock the Premium Trade Alerts with a Full Trading Plan in the Members Area.

Discount code: OFF25 for -25% expires in...

Free Watch List for Jul 15 2025 Read More »

Free Watch List for Jul 14 2025

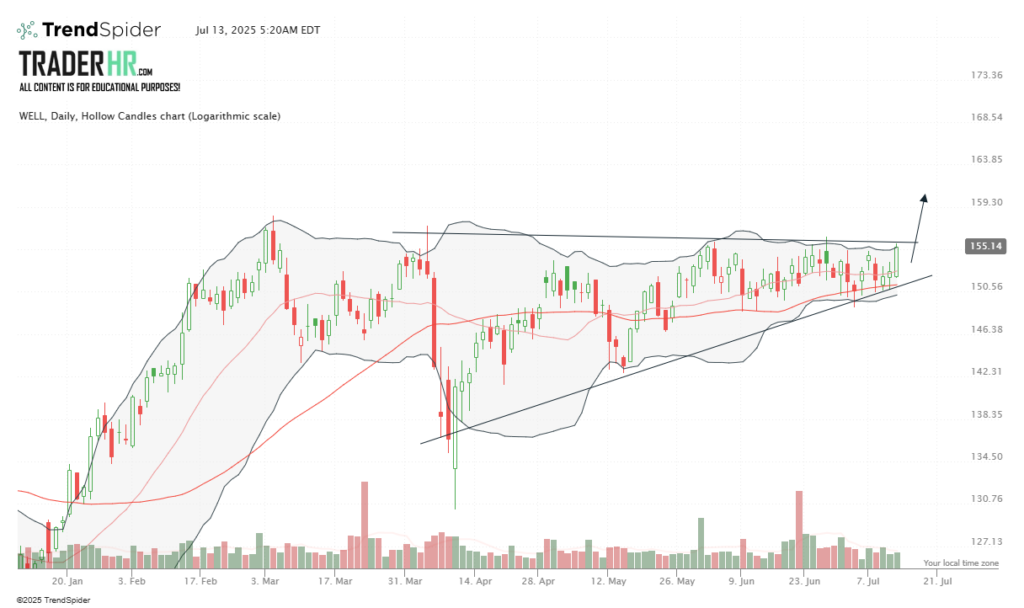
WELL is displaying a bullish pattern as an ascending triangle forms near strong resistance at 155. A potential breakout with significant volume could propel the stock towards the 163–168 range. The price action is supported by higher lows, indicating a sustainable uptrend. Furthermore, the stock is holding above key moving averages, highlighting the underlying bullish momentum. Traders should closely monitor the breakout for potential trading opportunities.
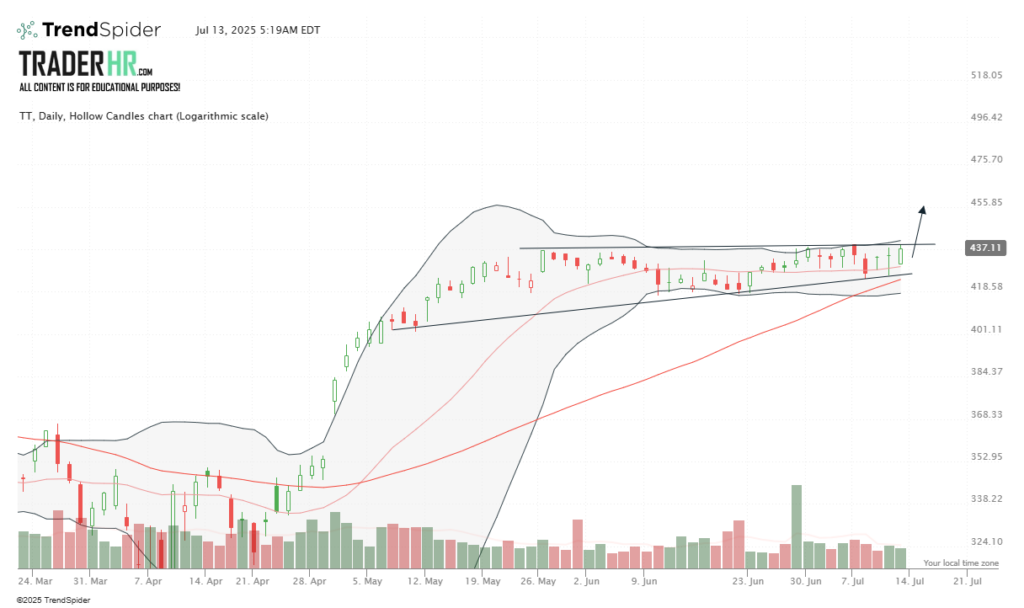
TT is currently at the upper boundary of a horizontal channel, with potential for a breakout above 440-445. A decisive move with strong volume could propel the stock towards the 456-475 range. Consolidation above key moving averages reinforces the bullish outlook. Traders should monitor for confirmation of sustained upward momentum.
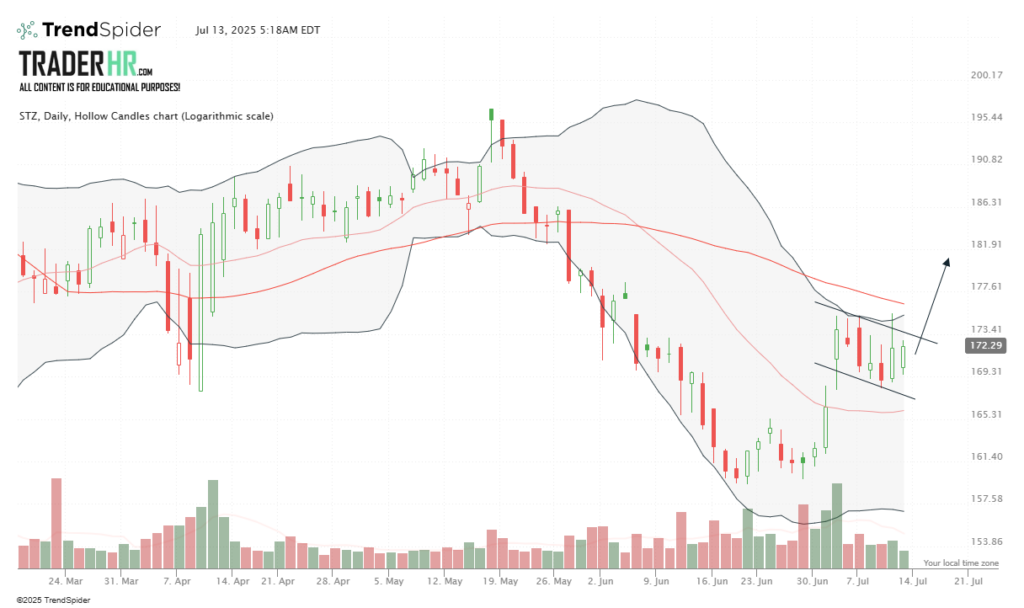
STZ is exhibiting a bullish breakout pattern near the 50MA, accompanied by a surge in trading volume. A move above 173.50 could spark a rally towards the 181–185 resistance area. The elevated volume suggests a potential trend shift, indicating strong bullish momentum. Traders should monitor for sustained volume to confirm the breakout.

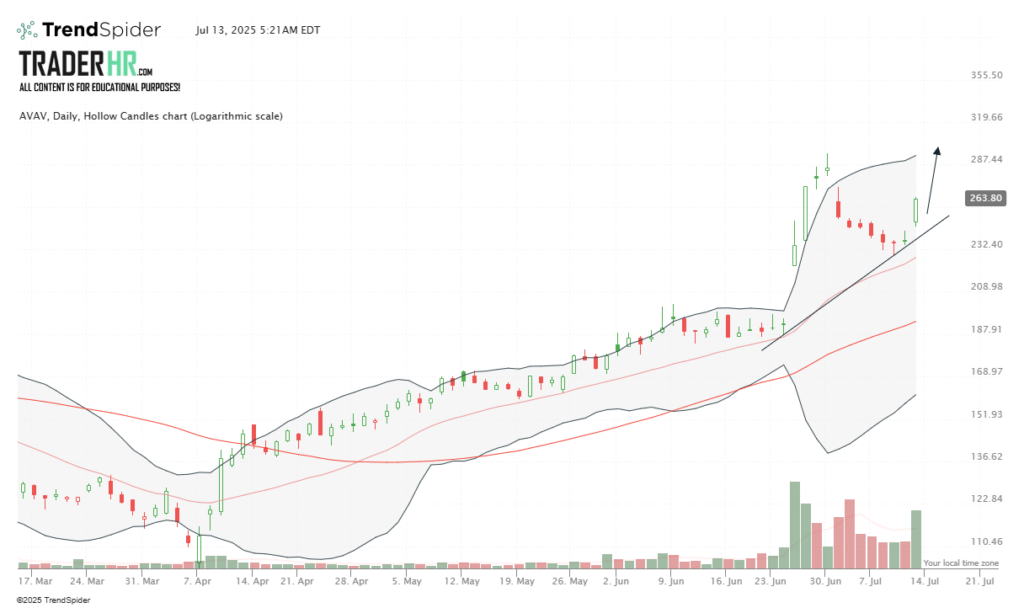
AVAV is showing signs of a strong rebound as it bounces off trendline and 50MA support, bolstered by a robust green candle and increasing volume. A breakout above 264 may ignite a bullish move toward the 287–320 zone. Momentum is shifting towards the bulls, indicating potential follow-through. Traders should monitor for confirmation of the upward trend.

Unlock the Premium Trade Alerts with a Full Trading Plan in the Members Area.

Discount code: OFF25 for -25% expires in...

Free Watch List for Jul 14 2025 Read More »

Scroll to Top