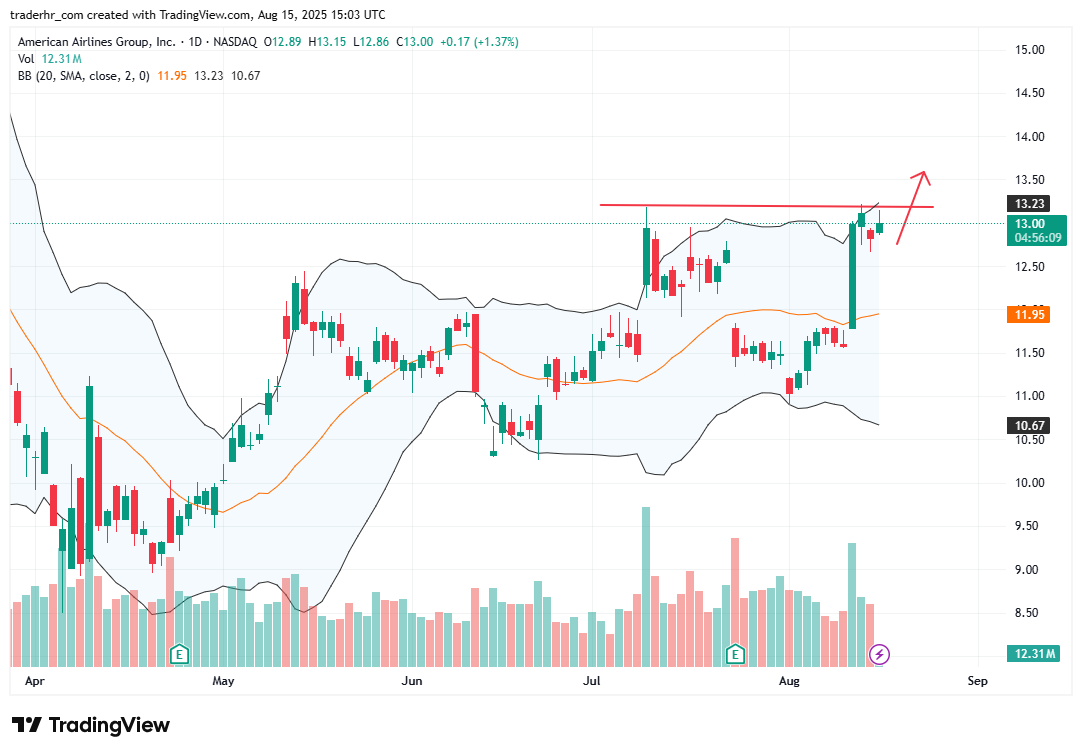
The chart for American Airlines shows a recent breakout attempt approaching resistance around 13.00. The price is currently trading near this level, with volume spikes indicating increased interest. The Bollinger Bands are converging, suggesting potential volatility ahead. If momentum continues, a sustained break above the resistance could lead to further upside. Conversely, a failure to hold this level may lead to a pullback towards the 11.95 support area, which has previously acted as a floor.

Charts To Watch – AAL
