The AAPL chart shows a recent period of tight consolidation after a notable uptrend. The price is currently positioned near a potential breakout level, with several consecutive green candles suggesting buying interest. The Bollinger Bands are narrowing, indicating reduced volatility which often precedes a price movement. It will be crucial to monitor volume trends as they can provide insights into market strength and direction in the upcoming sessions.
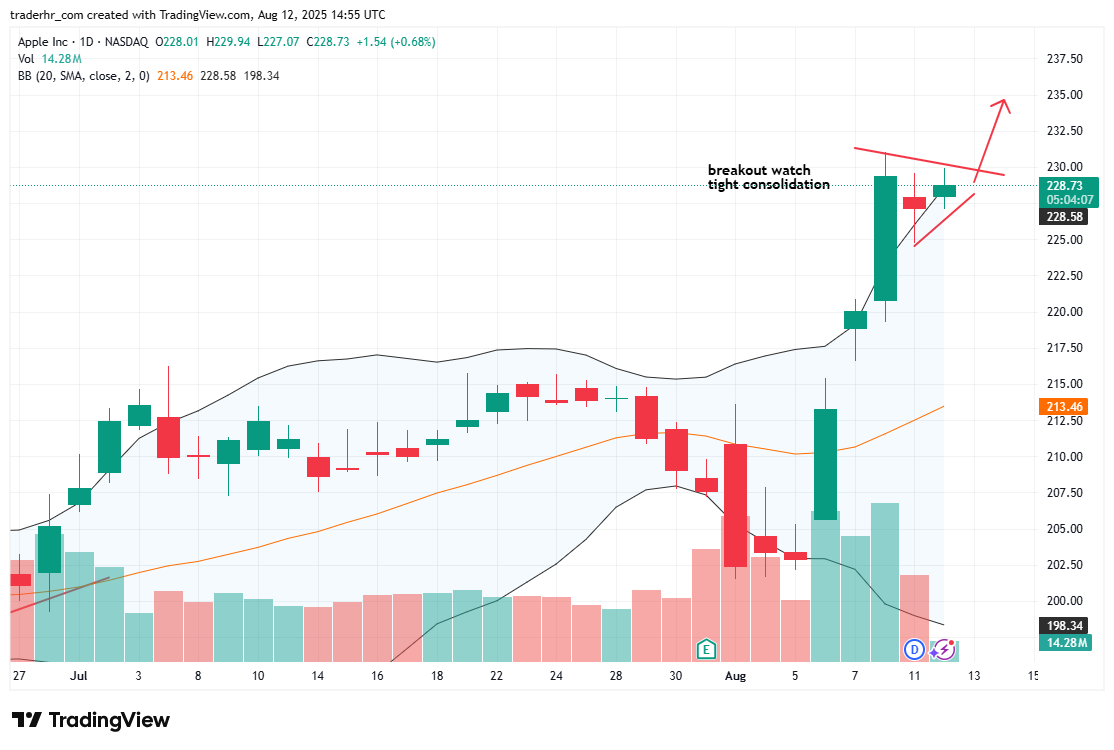
Charts to Watch – AAPL