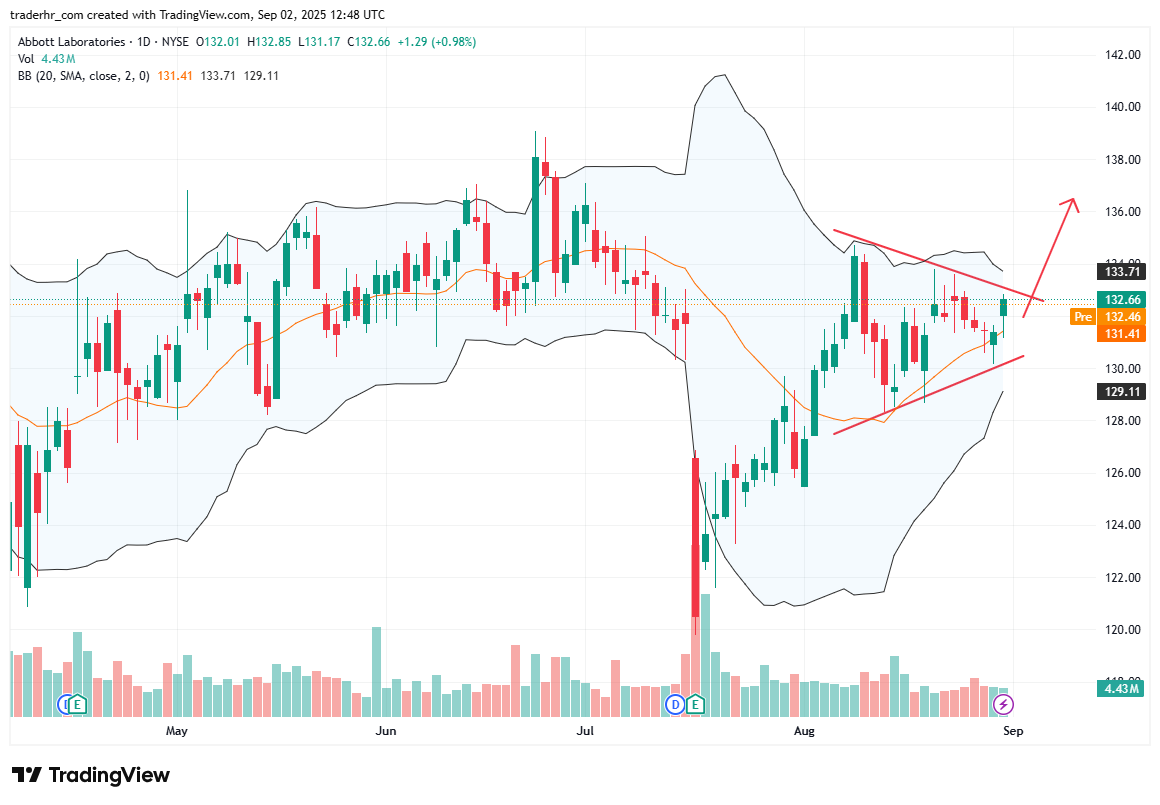
The stock displays a symmetrical triangle pattern, suggesting potential volatility as it moves toward a breakout point. Notable bullish candles have emerged in recent sessions, supported by increasing volume. The moving averages are converging, indicating indecision among traders. The Bollinger Bands are tightening, signaling a potential price expansion soon. Watch for subsequent price action to identify a breakout direction.
Charts To Watch – ABT