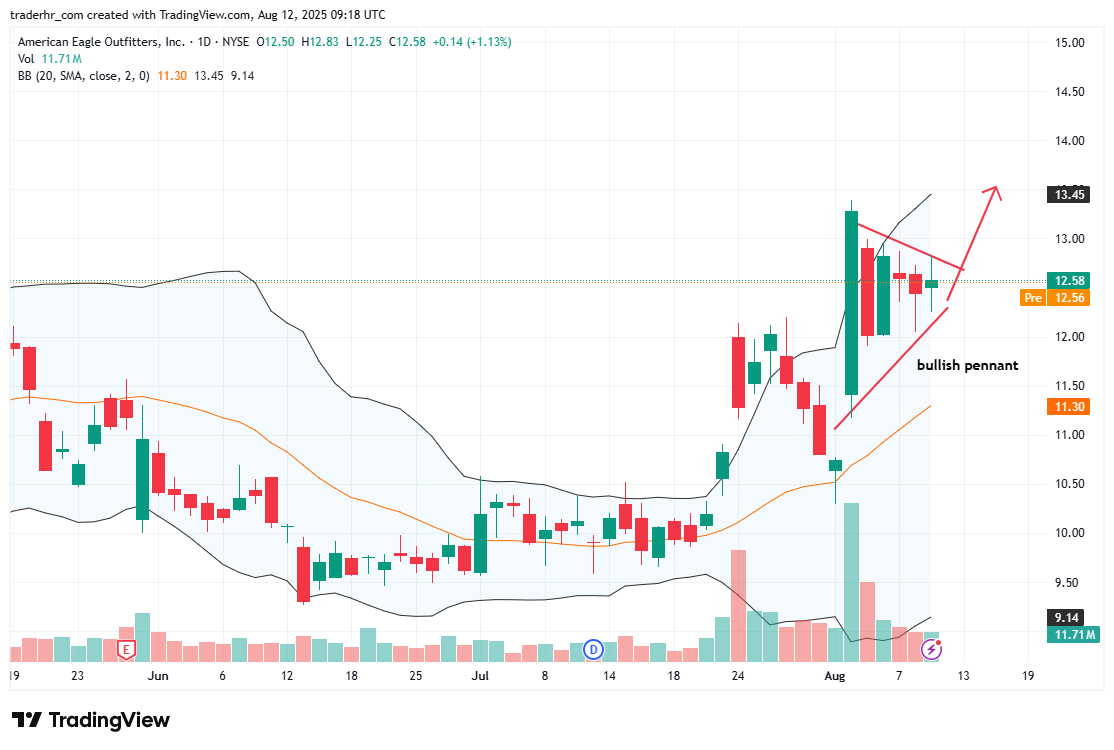
The recent chart for American Eagle Outfitters shows a bullish pennant formation, indicating potential upward momentum. The stock has been consolidating around the 12.50 to 12.60 range after a notable rally. The Bollinger Bands are tightening, which often suggests an impending breakout. Volume spiked during the upward movement, adding to the bullish sentiment. Monitoring price action near the apex of the pennant will be crucial for forecasting the next direction.

Charts to Watch – AEO
