The chart for AMC Networks displays a recent upward trend characterized by a series of higher lows and an emerging bullish wedge pattern. The Bollinger Bands indicate a period of consolidation with decreasing volatility, suggesting potential for a breakout. The most recent price action shows a recovery towards the upper band, which may signal continued upward momentum if buying interest persists. Volume trends appear supportive of this potential move, warranting close monitoring.
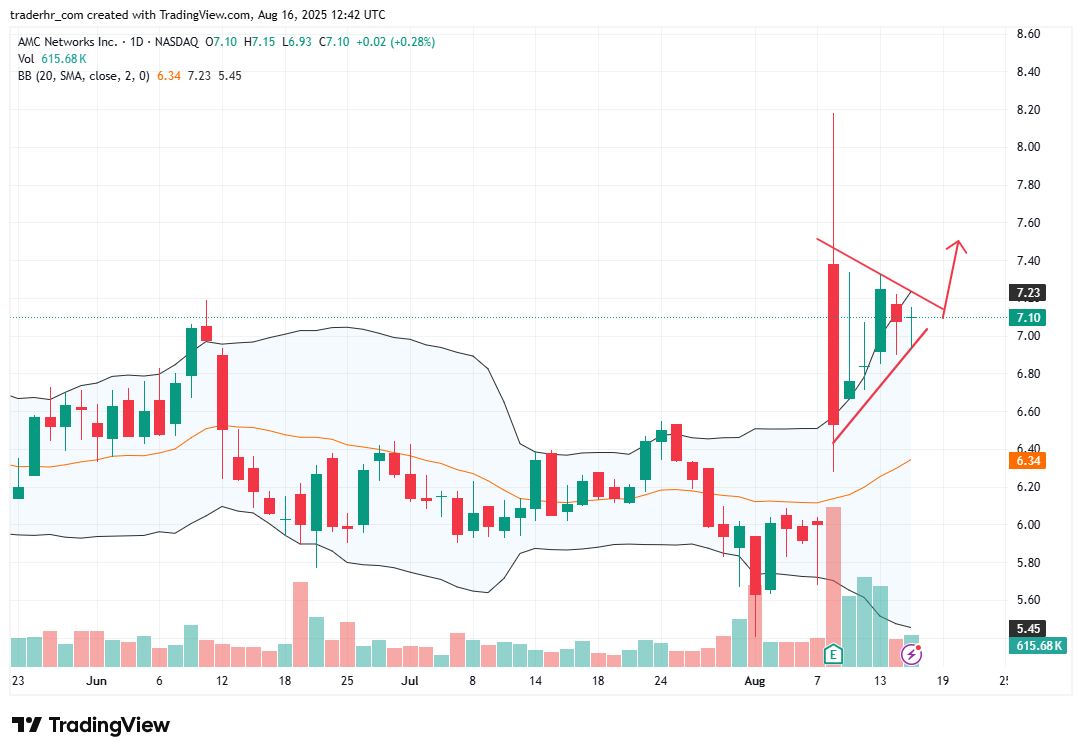
Charts To Watch – AMCX