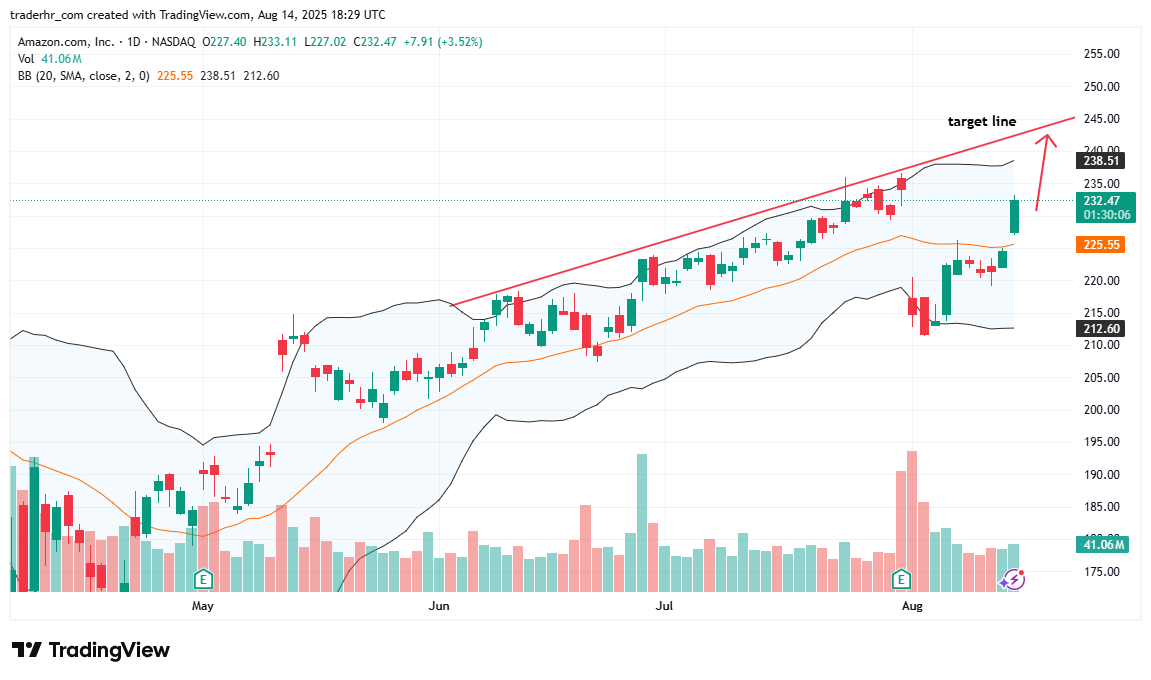
The chart shows Amazon.com, Inc. trending in an upward channel since May. Recent price action indicates a clear bounce off the lower Bollinger Band, with the price moving back towards the upper band. The volume trend is supportive, particularly with the recent surge, suggesting heightened interest. The 20-day SMA is also trending upwards, reinforcing the bullish sentiment. The next key observation will be whether the price can maintain momentum and break through resistance near the upper channel line.
Charts To Watch – AMZN