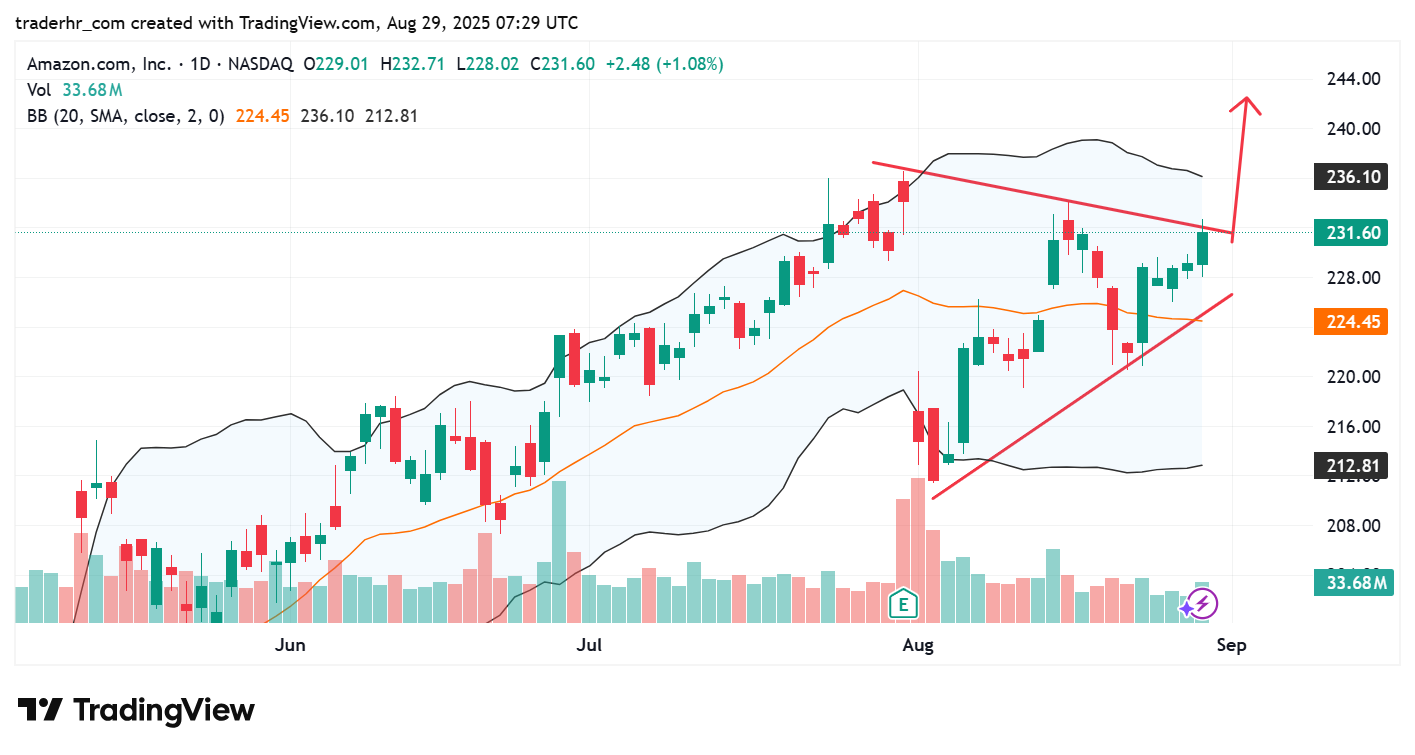
The chart shows Amazon, Inc. forming a bullish ascending triangle pattern, suggesting potential upward movement. Recent price action has tested the upper boundary, indicating increased buying interest. The Bollinger Bands are widening, reflecting potential volatility. The 20-day moving average appears to provide support, while volume has been relatively strong, adding to the bullish sentiment. A break above the resistance level could signal further gains.

Charts To Watch – AMZN
