The chart shows a recent upward trend with the price testing resistance around the upper Bollinger Band. Following a consolidation phase, the stock appears to regain momentum, supported by a rising 20-day moving average. Volume has been relatively steady, hinting at sustained interest. The proximity to previous resistance suggests potential for further movement if momentum continues. Overall, the stock may experience increased volatility as it approaches key price levels.
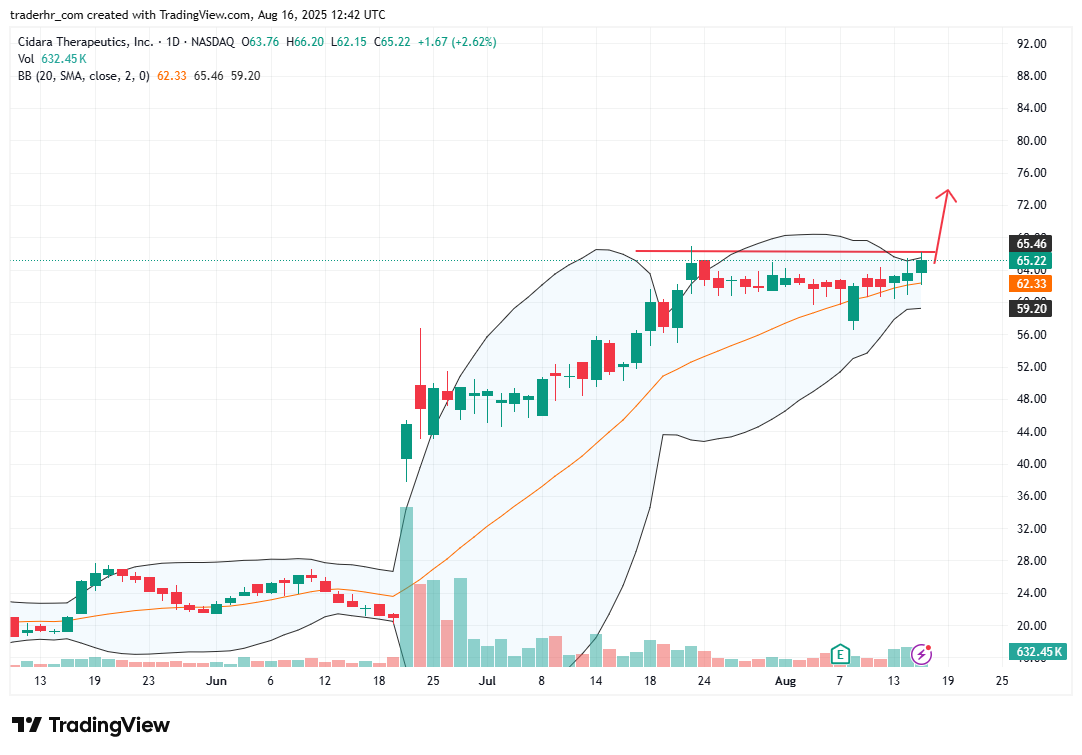
Charts To Watch – CDTX