The chart shows a recent consolidation phase around the 8.20 level, with a noticeable upper resistance near 8.70. The price is forming a potential breakout pattern, as it approaches the upper Bollinger Band. Volume has been supportive, with increased activity accompanying price gains. A strong close above the 8.70 mark may signal further bullish momentum. Additionally, the moving averages indicate a positive trend, providing a backdrop for potential upward movement if the resistance is broken.
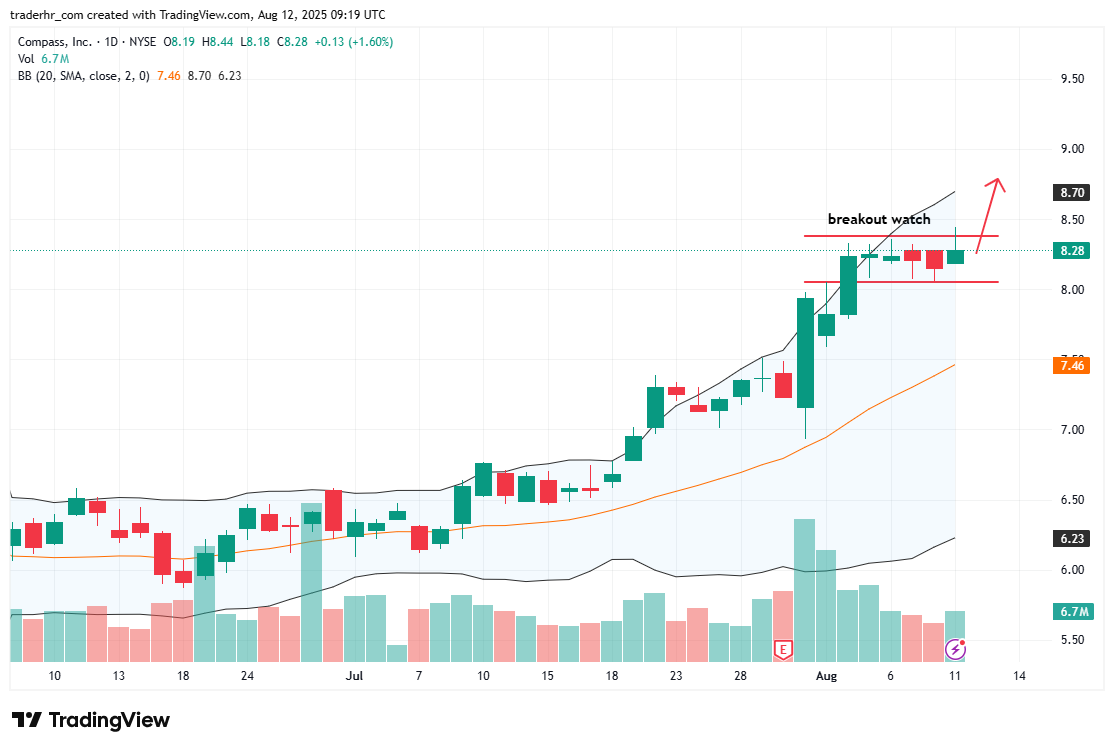
Charts to Watch – COMPASS