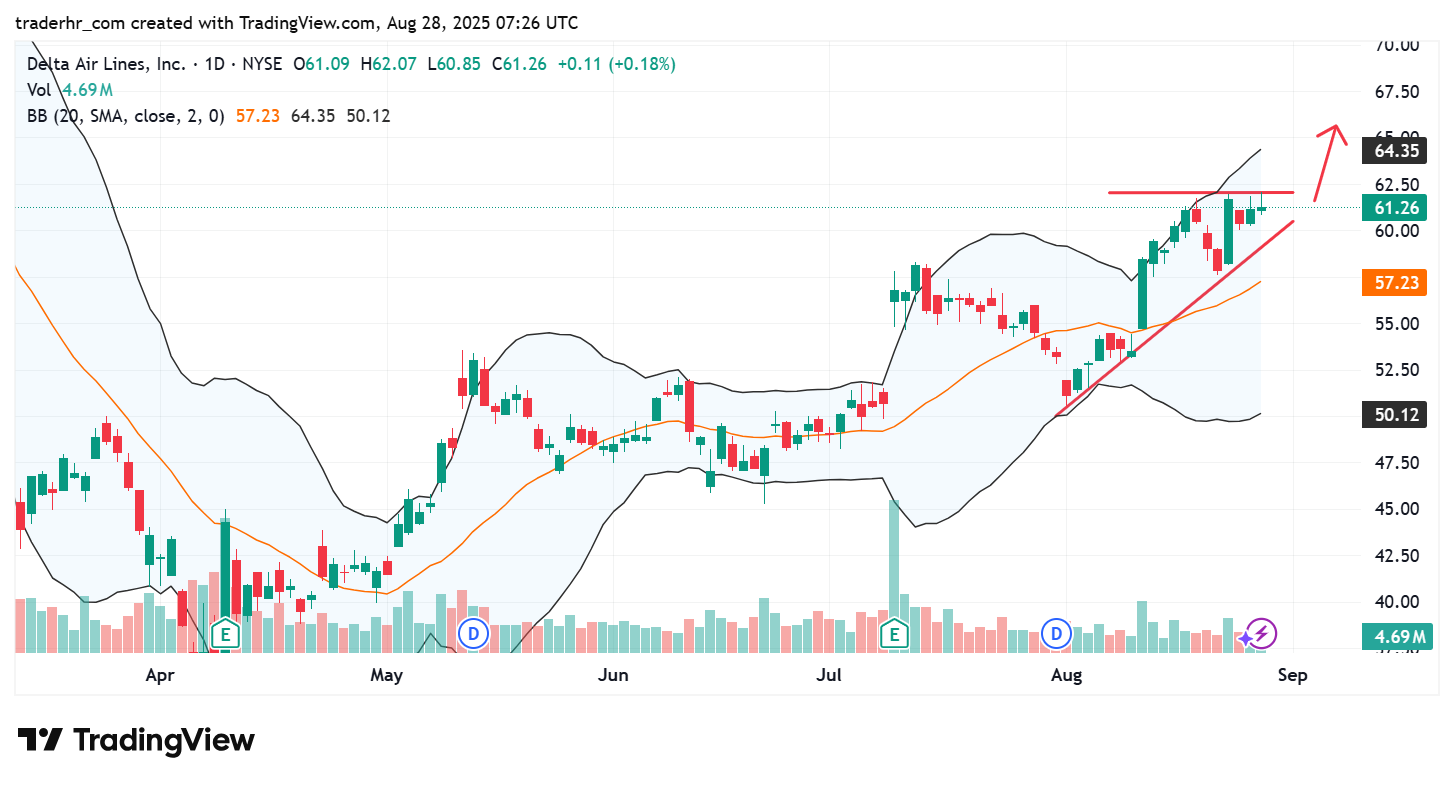
The chart highlights a recent upward trend in Delta Air Lines, with a strong move towards resistance around the recent highs. The price is making higher lows, supported by the rising 50-day moving average. Bollinger Bands indicate potential volatility, as the price approaches the upper band. Watch for potential breakout patterns as the stock nears the resistance level, while the volume shows considerable interest. A healthy consolidation period might precede further directional moves.
Charts To Watch – DAL