The chart shows a pennant formation, indicating potential price consolidation. The stock has recently bounced off support near the lower Bollinger Band while approaching the upper band, suggesting increased volatility. Volume trends appear moderate, reflecting cautious interest. Key moving averages are converging, which may signify an upcoming directional movement. Traders should monitor closely for any breakout or breakdown, as this pattern often precedes significant price action.
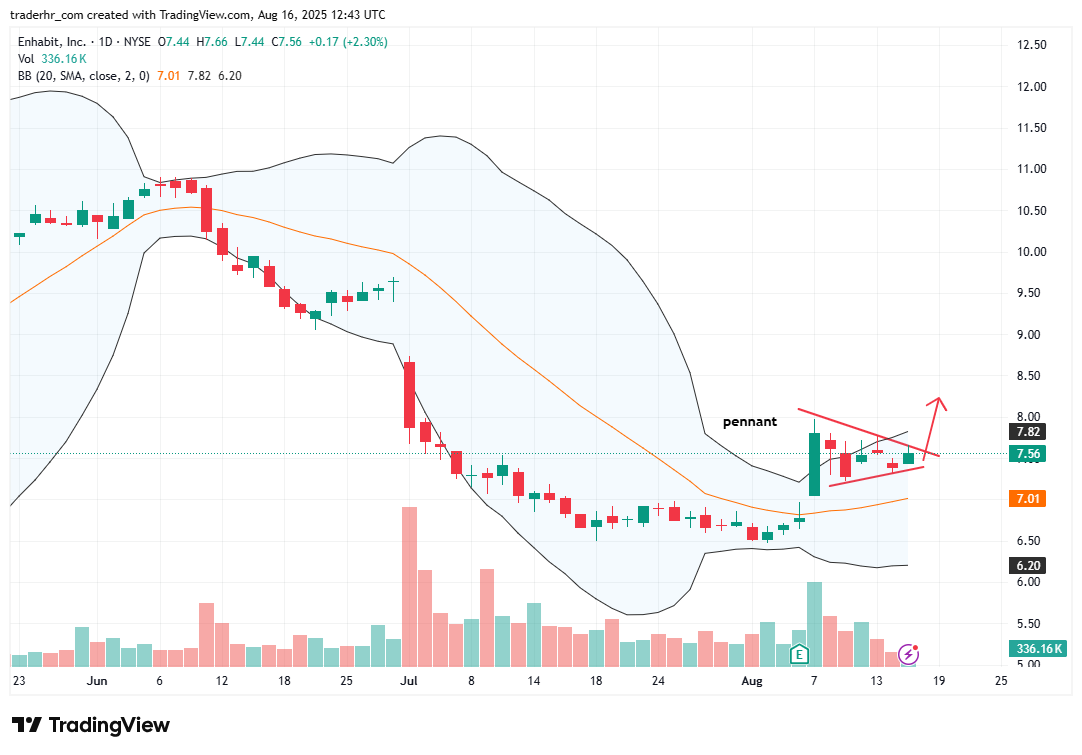
Charts To Watch – EHAB