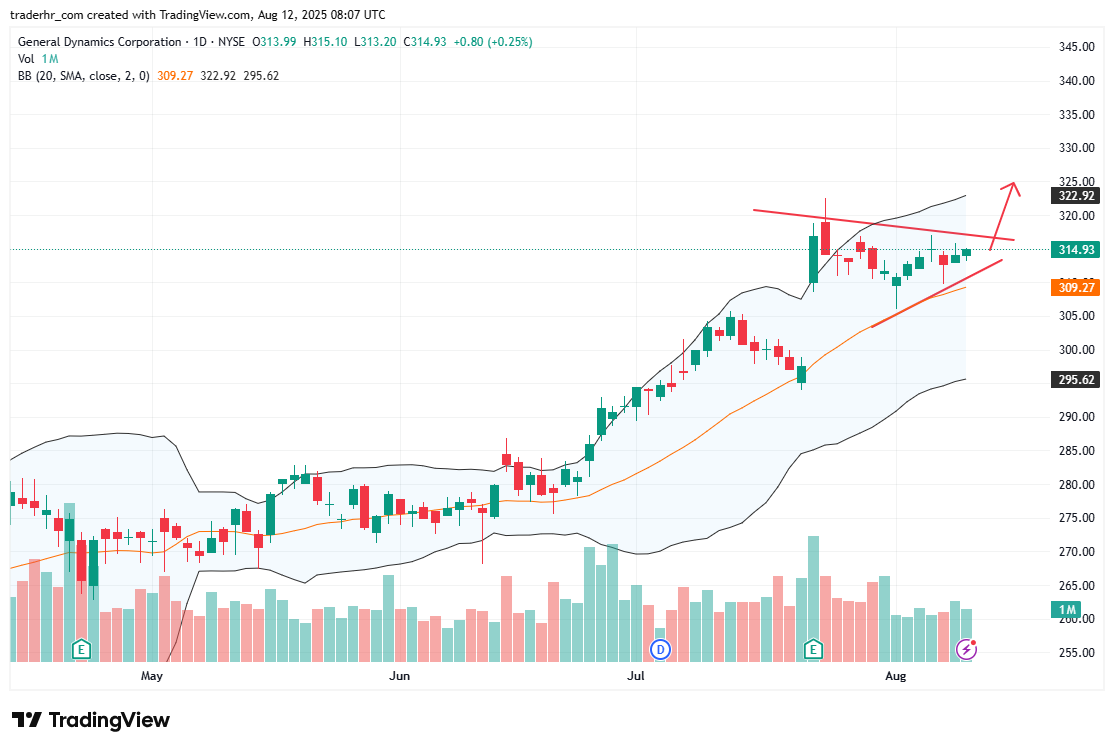
The chart displays General Dynamics Corporation in a defined upward trend, with prices consistently above the 20-day simple moving average. A triangular consolidation pattern is emerging, suggesting potential volatility in the near term. The Bollinger Bands indicate a period of low volatility, while recent price action shows attempts to break above previous resistance levels. Volume appears to be expanding, which may support upward momentum if a breakout occurs.

Charts to Watch – GD
