The stock shows a recent bullish trend with increasing price action and volume, particularly evident in the last few weeks. The price has been testing resistance around the $54 mark, indicating potential for further movement. The Bollinger Bands suggest that volatility may be increasing, which could lead to significant price fluctuations. The 50-day simple moving average is acting as a support level, which may provide additional bullish sentiment if the price remains above it.
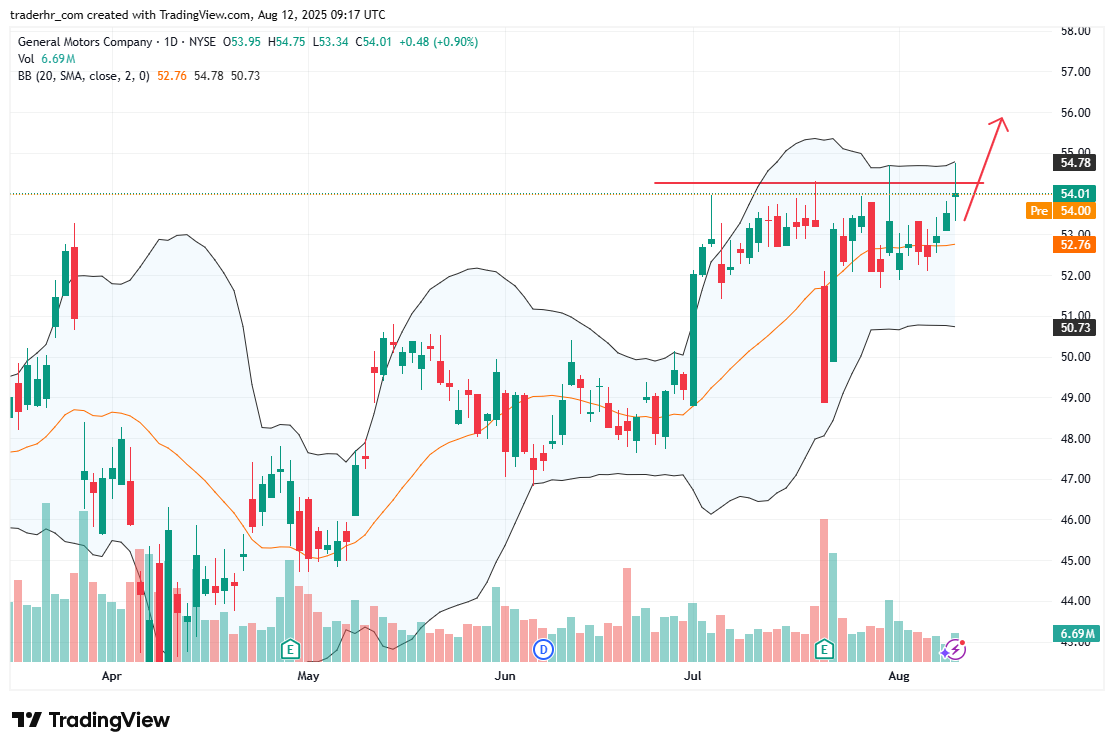
Charts to Watch – GM