The chart for Integra LifeSciences shows a notable consolidation phase, with price action fluctuating within a defined range around the $12.50 level. A recent upward movement has brought the price near the trendline resistance, which if breached, may signify a bullish reversal. The Bollinger Bands are expanding, indicating increasing volatility. Volume patterns suggest heightened activity, particularly around key levels, which could support a potential breakout. Monitoring the resistance at $13.80 will be essential for identifying further direction.
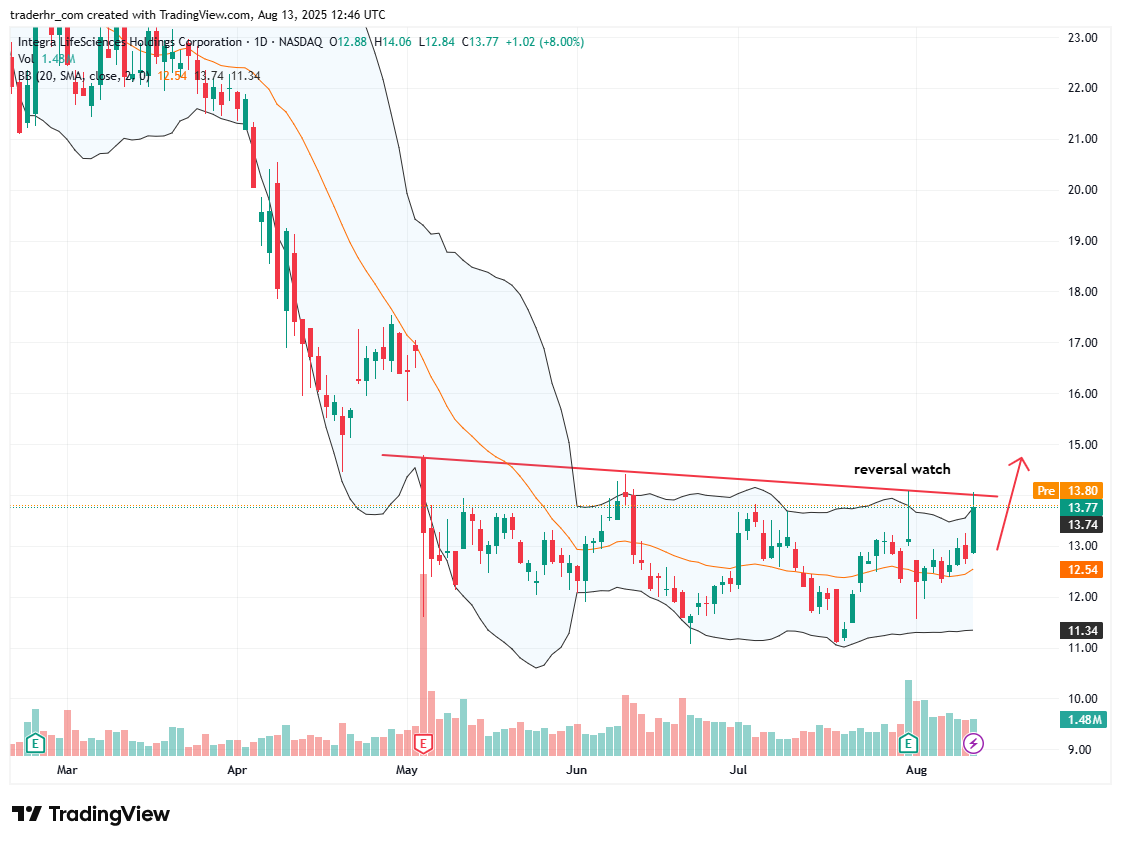
Charts To Watch – IART