The chart shows INTC exhibiting upward momentum with a recent break above its moving average, indicating potential bullish sentiment. Volume has been notably high during recent price increases, suggesting strong buying interest. The Bollinger Bands indicate reduced volatility, which may precede a significant price movement. Key resistance seems to lie around the recent highs, while support is established at the moving average. Watch for further confirmation of the trend as price tests these key levels.
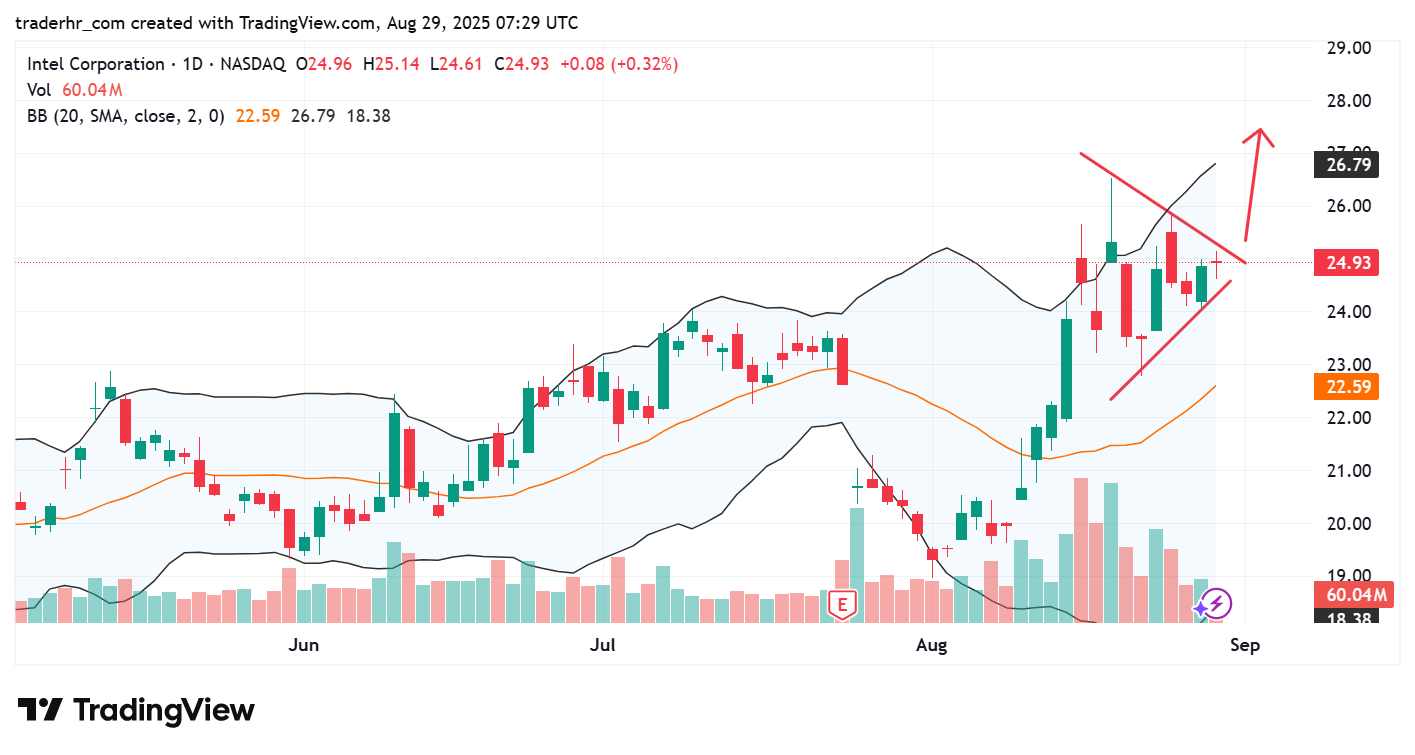
Charts To Watch – INTC