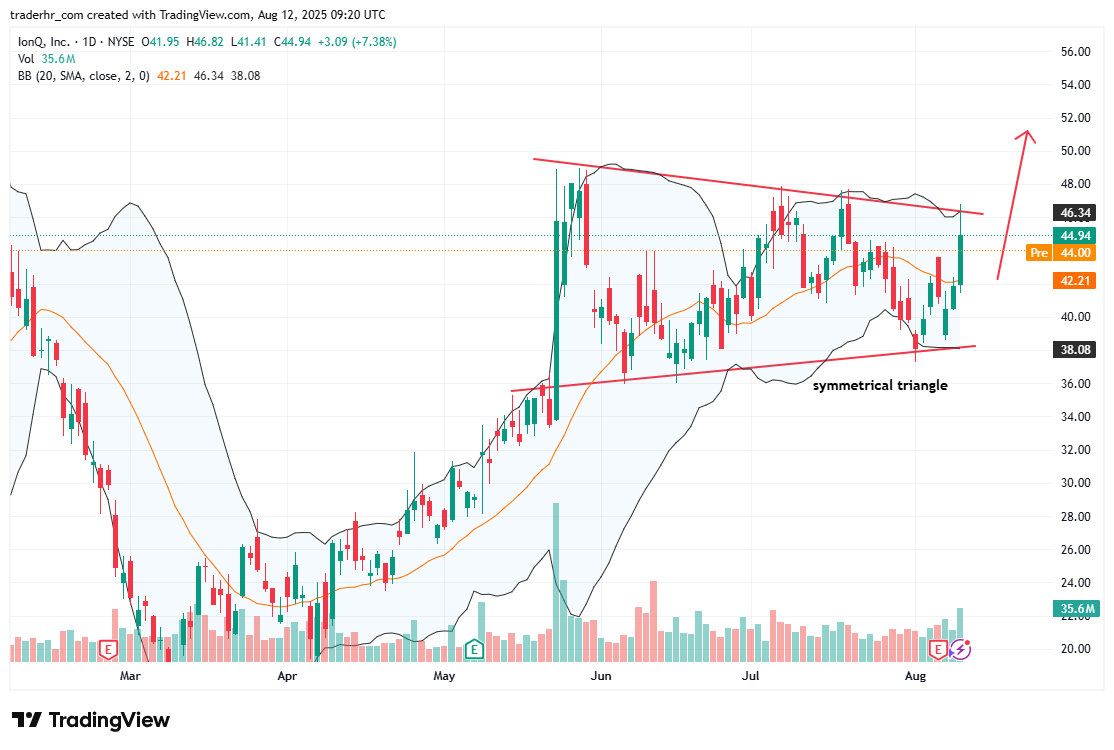
The chart shows IonQ, Inc. forming a symmetrical triangle pattern, indicating potential volatility as the price consolidates between converging trendlines. Recently, the price crossed above the 20-day moving average, suggesting upward momentum. Volume has picked up, especially around recent price movements, which may indicate increased interest. The Bollinger Bands are tightening, signaling a potential breakout in either direction. Traders should monitor key resistance and support levels as this pattern develops.
Charts to Watch – IONQ