The stock displayed a consolidation pattern within a narrowing range, indicated by the converging trend lines. The recent price action is testing the upper resistance while maintaining support along the rising trend line. The Bollinger Bands are also tightening, suggesting a potential increase in volatility. The moving average shows a supportive trend, reinforcing a bullish bias in the short term. Observers should watch for breakout signals from this pattern as momentum builds.
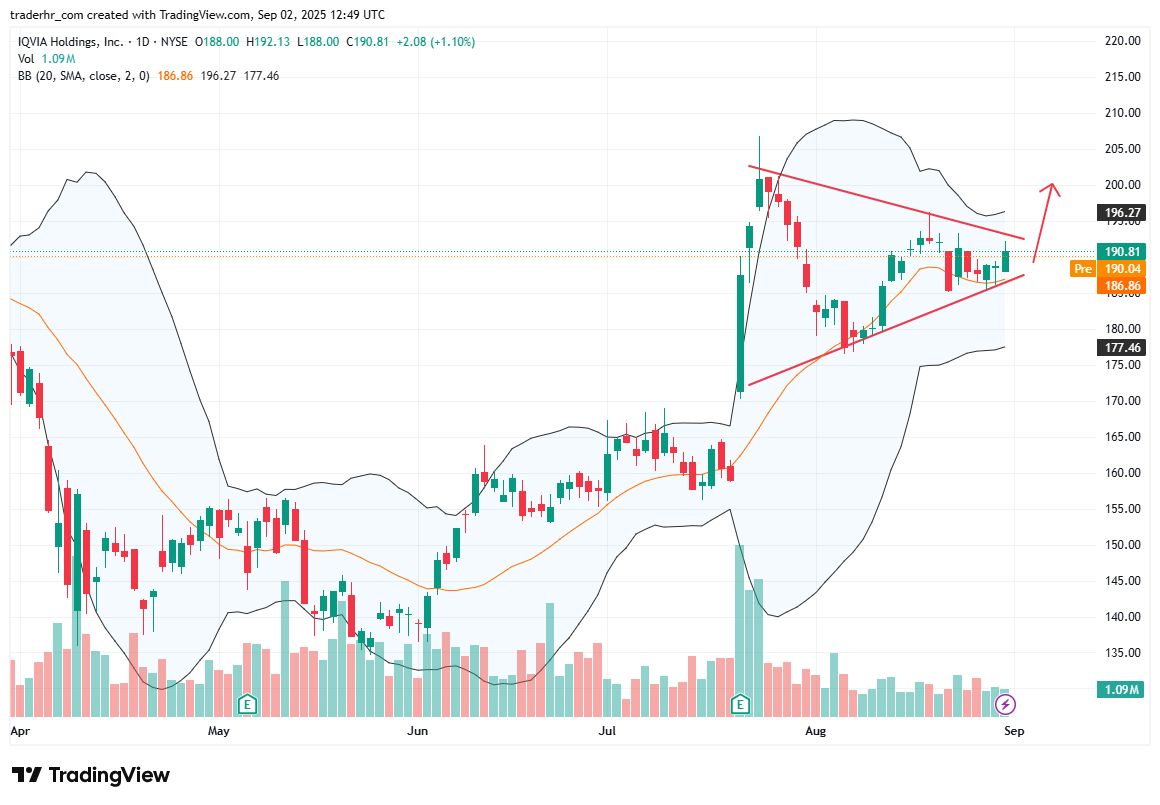
Charts To Watch – IQV