The chart for IQV shows a recent symmetrical triangle pattern with potential breakout signals. Price is testing upper resistance levels, while the Bollinger Bands indicate reduced volatility. Moving averages are flattening, suggesting a possible transition phase. Volume appears to be supportive of upward movement, especially on breaks of recent highs. Traders should keep an eye on key levels as price moves close to the apex of the triangle, which could dictate the next directional move.
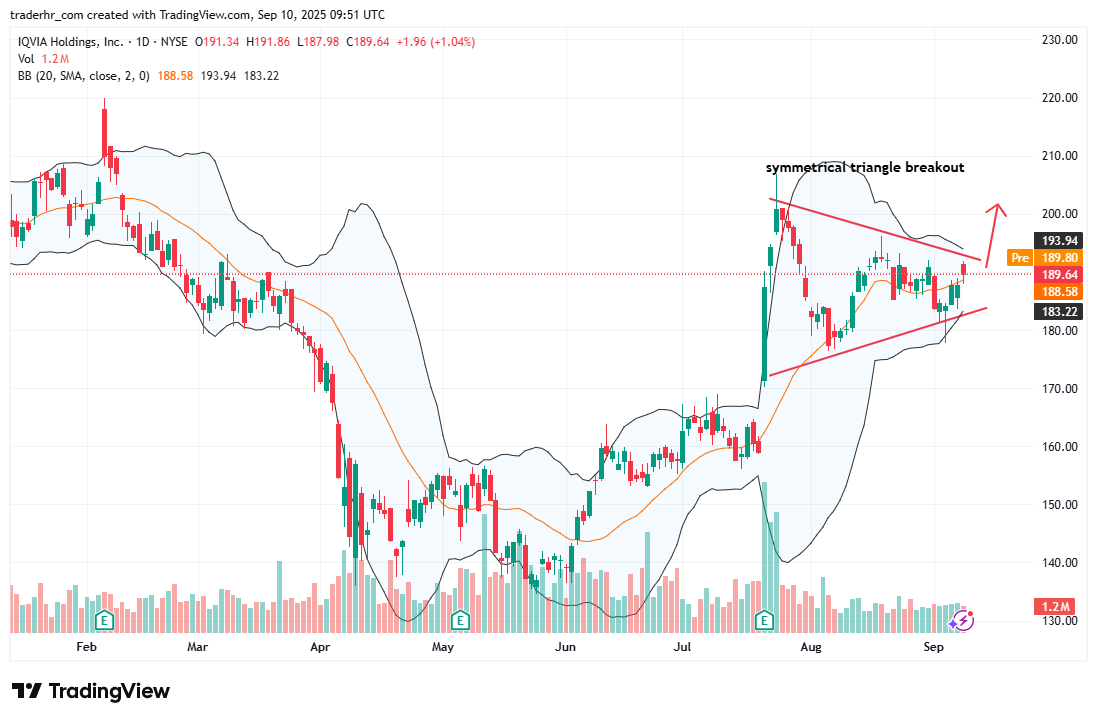
Charts To Watch – IQV