The stock has recently approached a resistance level around the 13.50 area, with bullish momentum noted in the latest candles. The Bollinger Bands suggest potential for volatility, as the price is currently testing the upper band. AMACD crossover indicates positive sentiment, while volume spikes could signify strong interest from traders. Should the price surpass the current resistance, it may open the door for further upward movement. Key support is established around the 12.59 mark, indicating a potential range to watch.
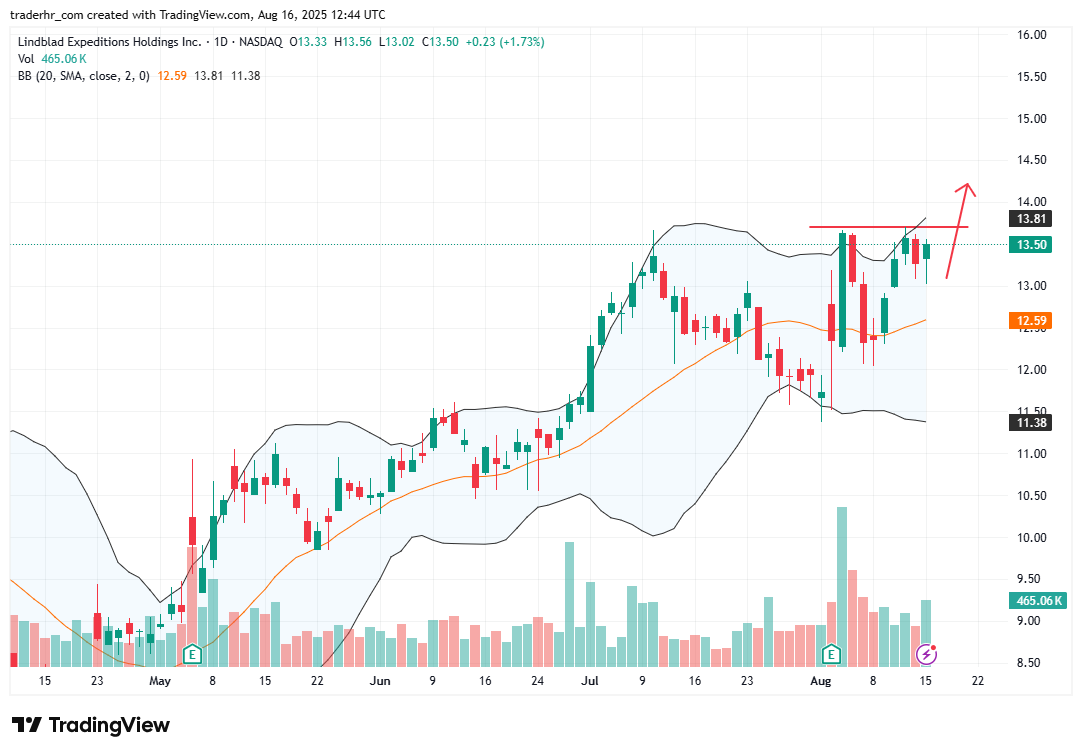
Charts To Watch – LIND