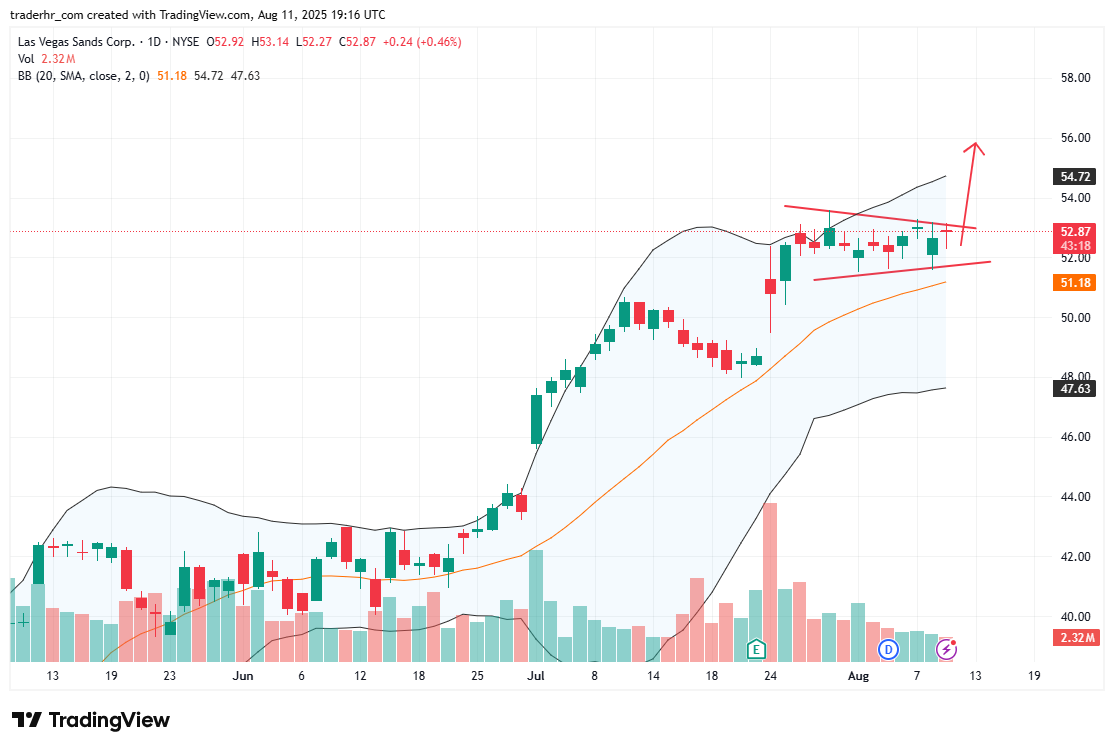
The chart shows Las Vegas Sands has recently formed a consolidation pattern, characterized by lower highs and relatively stable lows, indicating indecision in the market. The moving averages are beginning to converge, suggesting potential volatility ahead. The Bollinger Bands are narrowing, signaling a potential breakout in either direction. Watch for volume trends, as an increase might confirm any breakout potential. Overall, the stock is at a critical juncture, and price action will be key in determining future movements.
Charts to Watch – LVS