The chart displays a recent upward trend in the stock, supported by a steady rise along an ascending trendline. The stock is currently nearing a resistance level, indicated by the horizontal line around 525. The Bollinger Bands show the stock is trading within a tighter range, suggesting potential volatility. Volume has seen fluctuations but remains consistent, which may indicate increased interest. A breakout above the resistance could signal further upward momentum, while a reversal might see support tested near 511.
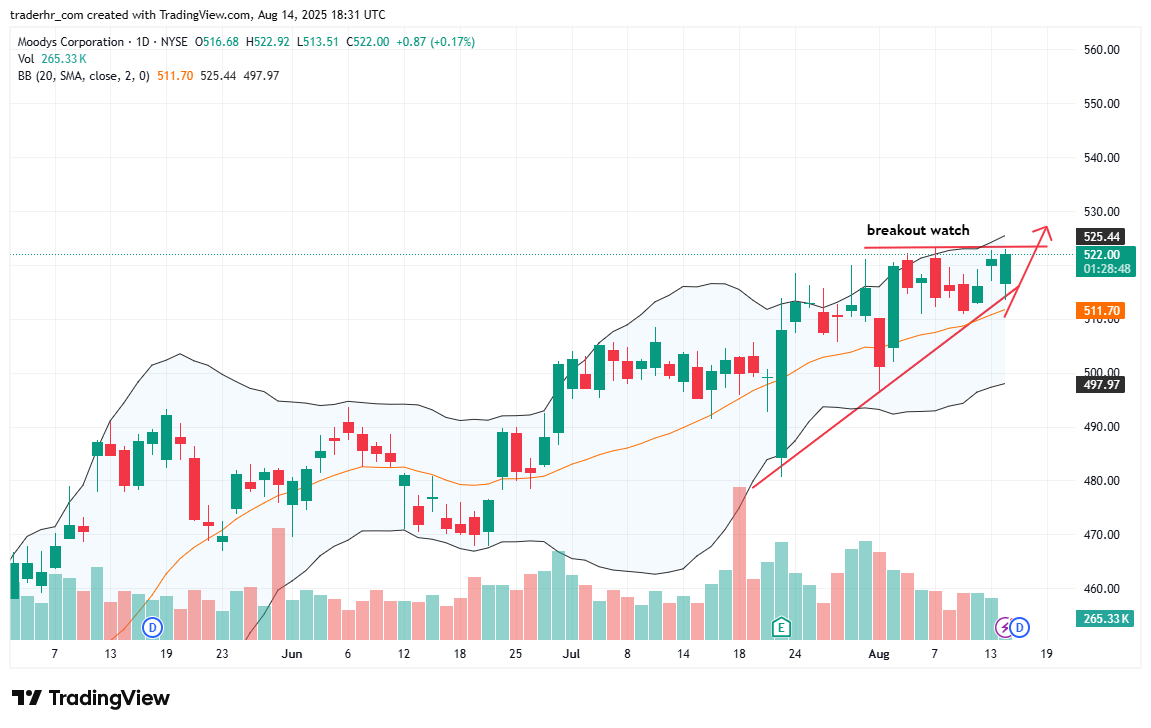
Charts To Watch – MCO