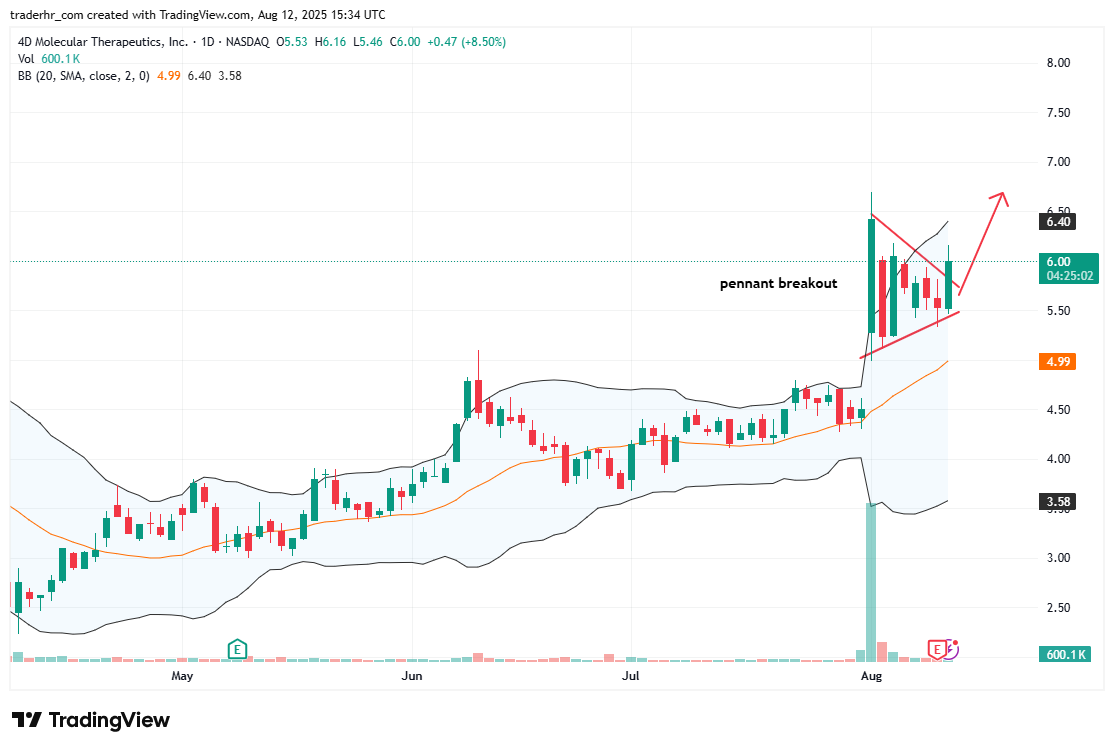
The chart displays a recent pennant formation, indicating a period of consolidation following upward momentum. A breakout from this pattern could signal further potential movement. The stock is currently trading within the Bollinger Bands, suggesting it may experience increased volatility. Volume appears to be picking up, which is often a precursor to significant price action. Observers should monitor for sustained moves beyond key resistance levels for potential trends.

Charts to Watch – FDMT
