The chart shows a recent breakout from a pennant formation, indicative of bullish sentiment. Prices have consistently hovered above the 20-day SMA, suggesting strong support in the near term. The Bollinger Bands are expanding, reflecting increased volatility and potential for further movement. Volume has been relatively high during this upward trend, signaling sustained interest. Monitoring the upper band may provide insights into potential resistance levels as the stock progresses.
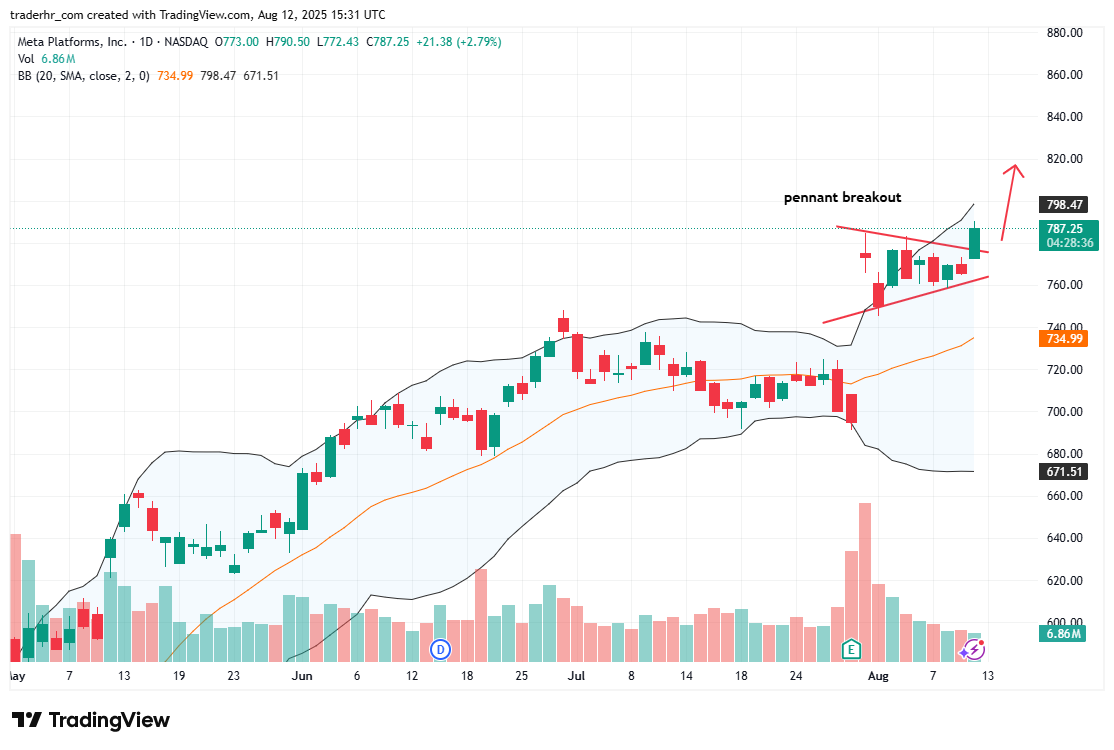
Charts To Watch – META