The chart for Mohawk Industries shows a strong upward trend with recent consolidation around the 132 level. The price is currently testing resistance at 136.11, suggesting a potential for breakout or reversal. The volume trend indicates increased interest, particularly with recent green candles. The moving averages provide support, with the 20-day MA positioned below current prices, enhancing bullish sentiment. Investors should monitor the price action near the resistance level for potential trading opportunities.
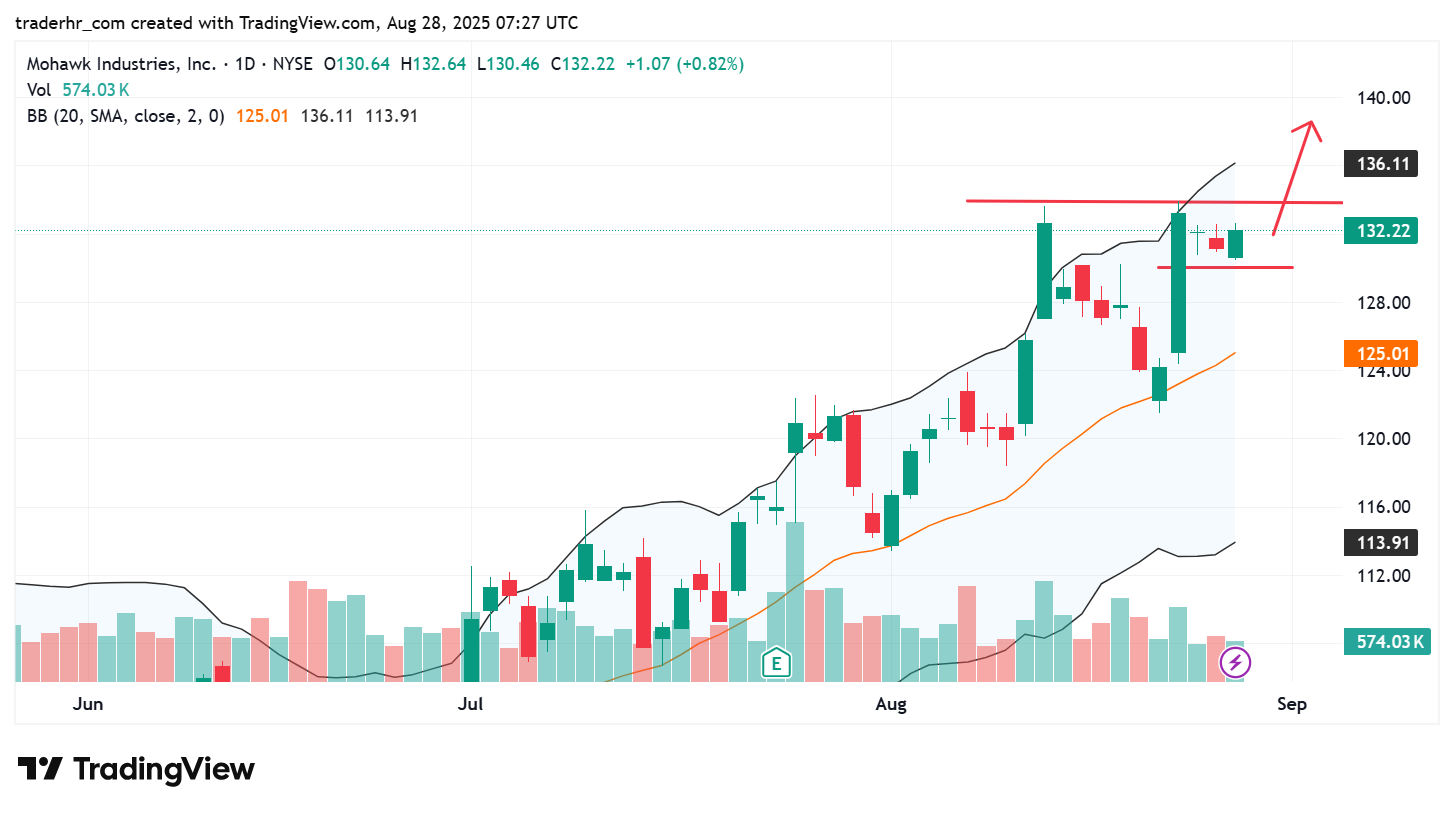
Charts To Watch – MHK