The chart displays a series of upward movements in price, particularly noticeable in the last few months. The stock has recently crossed above the moving average, suggesting strengthening momentum. Bollinger Bands indicate potential volatility, with the price nearing the upper band. Volume trends show increased participation in the most recent moves, reinforcing the current bullish sentiment. Observing how the price behaves around the recent peak may provide insights into potential continuation or correction patterns.
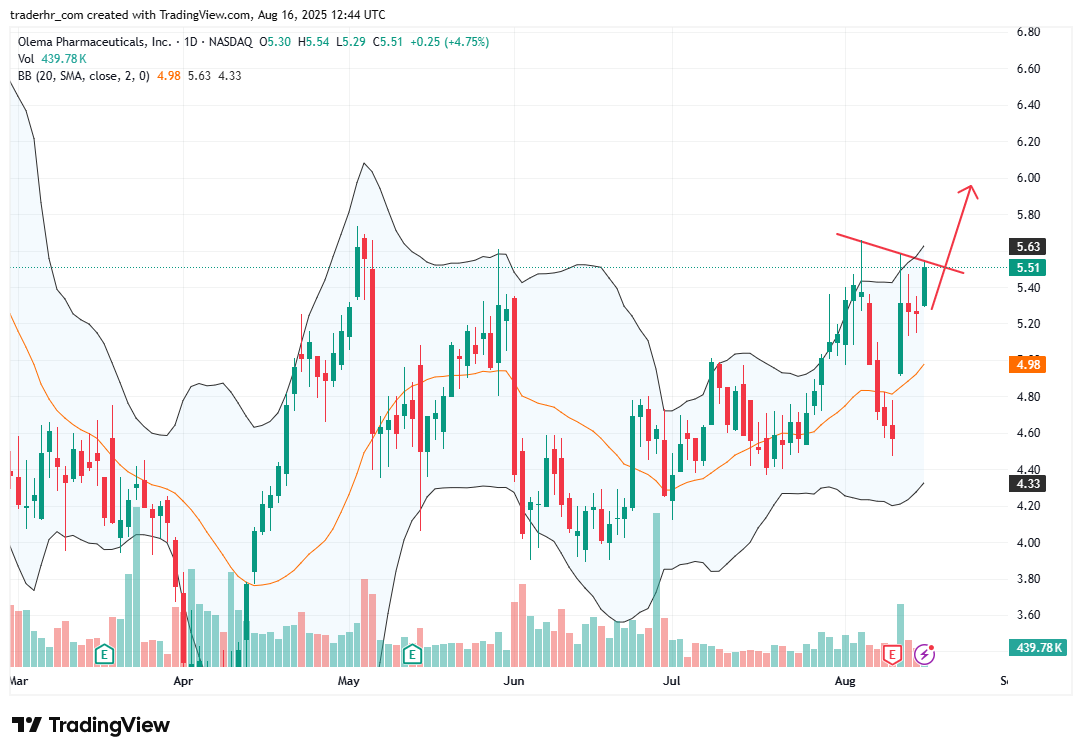
Charts To Watch – OLEA