The stock exhibits a period of consolidation within a defined range, indicated by horizontal resistance around the mid-50s and an ascending trendline below. Recent price action shows a bounce off the lower boundary, suggesting potential upward momentum. The Bollinger Bands are narrowing, indicating a period of low volatility, which may precede a breakout. Volume appears to be increasing as the stock approaches the resistance level, indicating growing interest. Traders should watch for a confirmed move beyond the resistance to gauge the next direction.
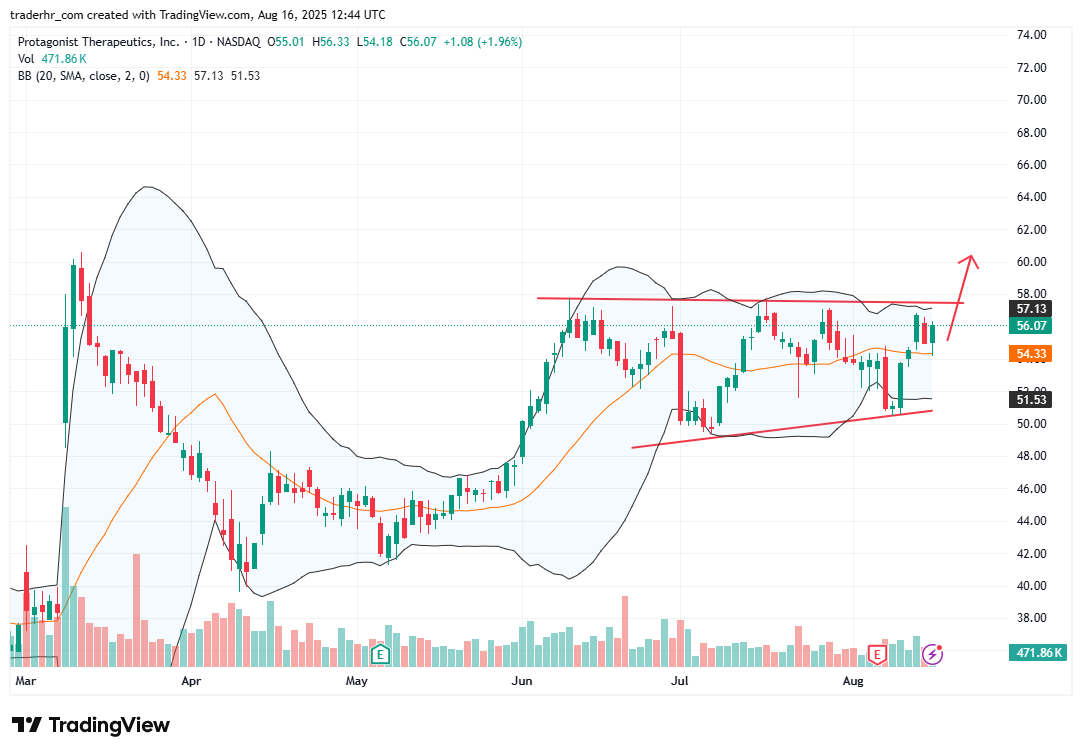
Charts To Watch – PTGX