The chart shows a consolidation phase following a strong upward movement in earlier months. Currently, the stock is approaching a resistance level, indicated by the horizontal line, with the recent price action suggesting a possible breakout. The Bollinger Bands are expanding, which may indicate increasing volatility. The 20-day SMA is sloping upward, supporting the bullish trend. Traders should monitor for confirmation of a breakout above the resistance, as this could signal further upward momentum.
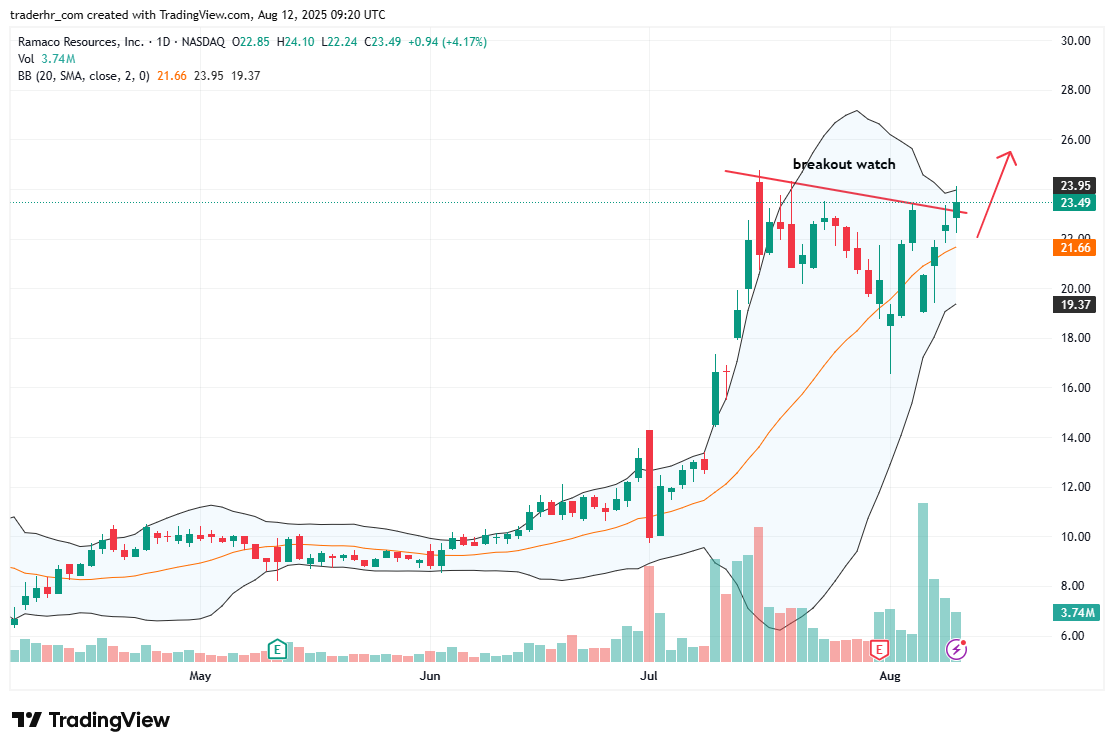
Charts to Watch – RAM