The chart for Rigetti Computing displays a symmetrical triangle pattern, indicating potential consolidation. The price has approached the upper trendline, suggesting potential movement upon breakout. The Bollinger Bands are tightening, reflecting decreased volatility. The 20-day moving average is positioned above the 50-day moving average, which may indicate a bullish trend if the price maintains above these moving averages. Watch for increased volume as it could signal a continuation or reversal upon breakout.
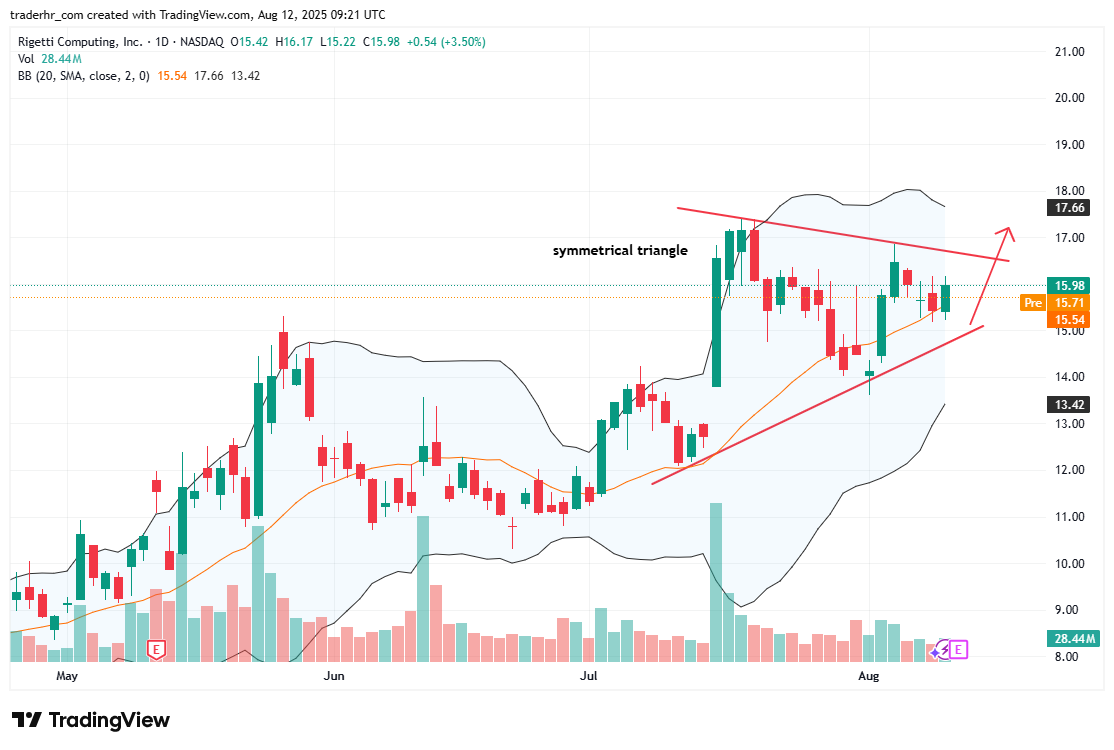
Charts to Watch – RGTI