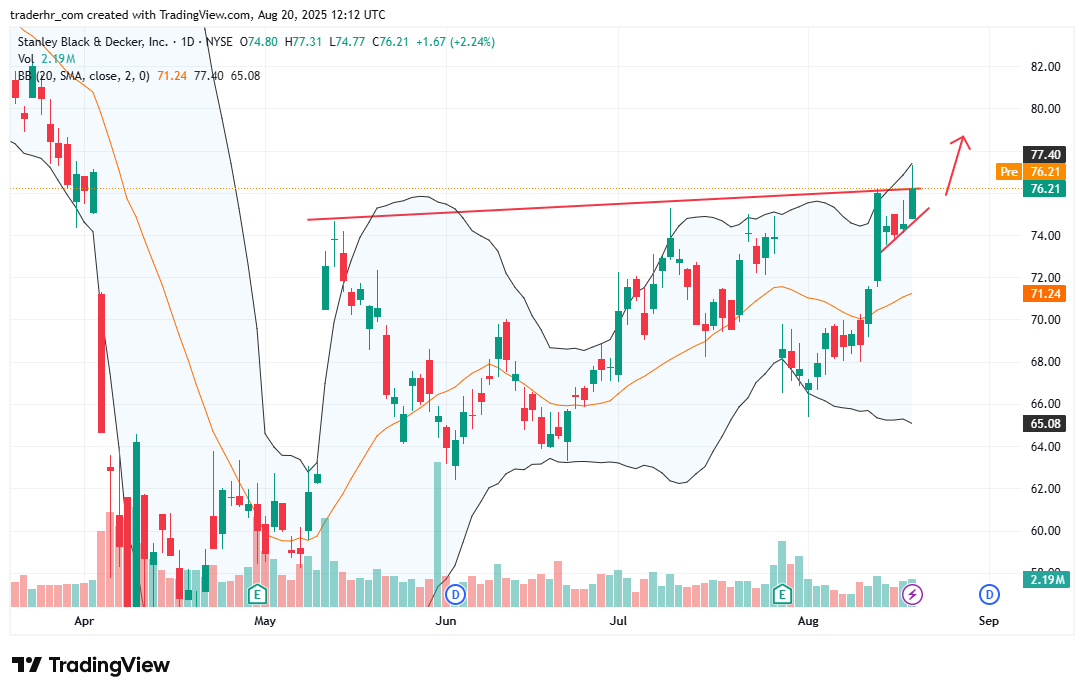
The stock shows a clear upward trend, recently breaking above a resistance line drawn from previous highs. The support from the 20-day moving average indicates potential bullish momentum. The Bollinger Bands are widening, which suggests increasing volatility. Notably, the recent trading volume appears higher, which could signify stronger investor interest. Watch for continued price action around the recent highs as it tests resistance levels.

Charts To Watch – SWK
