The chart for Terex Corporation shows a recent consolidation breakout from a downward trendline, indicating potential upward momentum. The price has closed above the 20-day SMA, which could signal strength. The Bollinger Bands are tightening, suggesting a possible increase in volatility. Watch for price behavior around these key levels to gauge further directional movement.
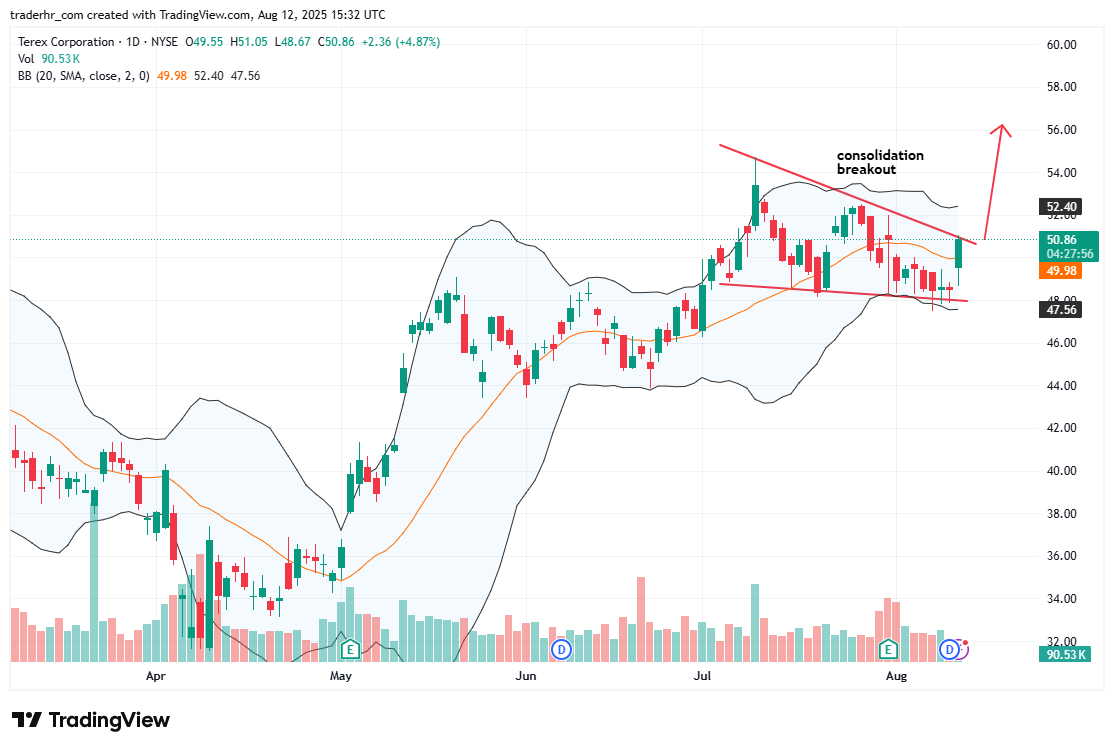
Charts To Watch – TEX