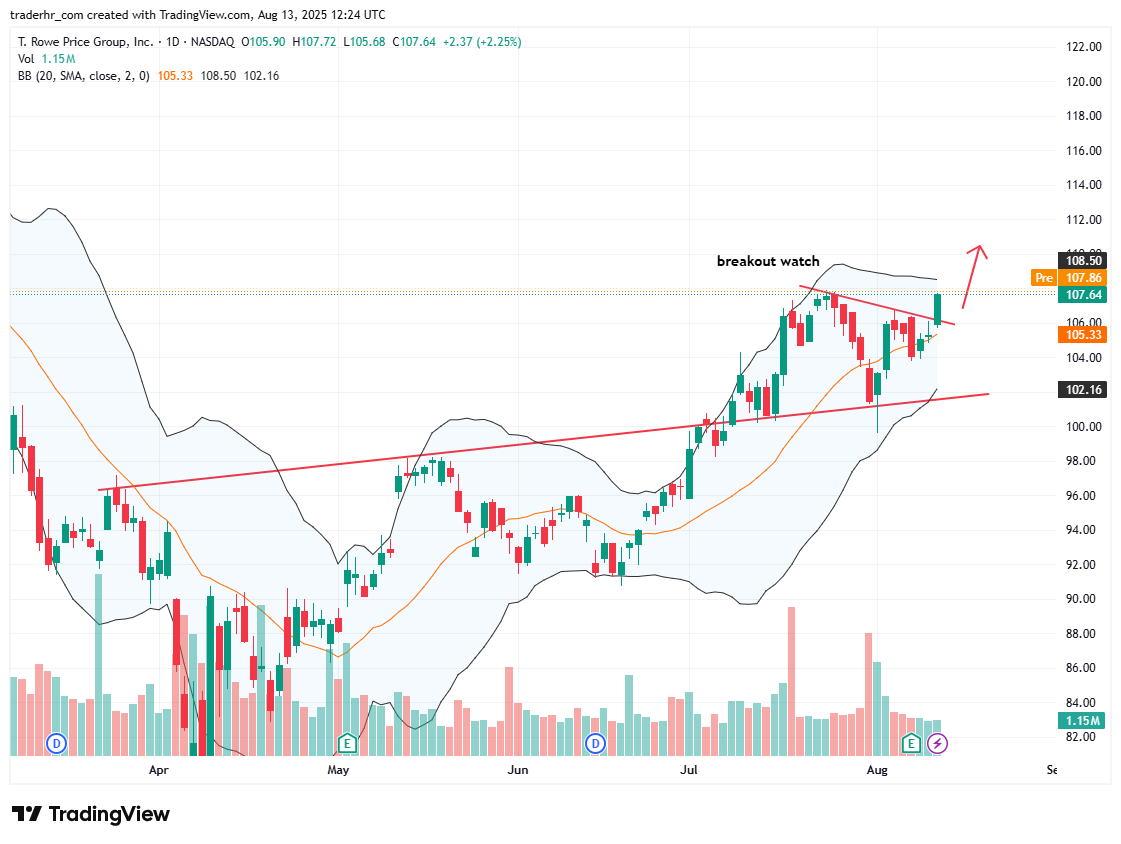
The chart for T. Rowe Price Group, Inc. shows a recent upward movement, with the price approaching a potential breakout point. The stock has been respecting an upward trend line since mid-June, indicating strong support. The Bollinger Bands are widening, suggesting increased volatility and potential for significant price action. Volume appears robust at recent highs, adding credibility to the uptrend. Traders should monitor the price closely for any breakout above resistance.

Charts To Watch – TROW
