The chart indicates a potential breakout for Tesla, with price action recently rebounding from a key support level around the trendline. The Bollinger Bands are narrowing, suggesting decreasing volatility, which could precede a significant price movement. The volume shows a slight increase during the recent upward movement, indicating potential buying interest. Key resistance levels will be crucial to watch as the price approaches previous highs.
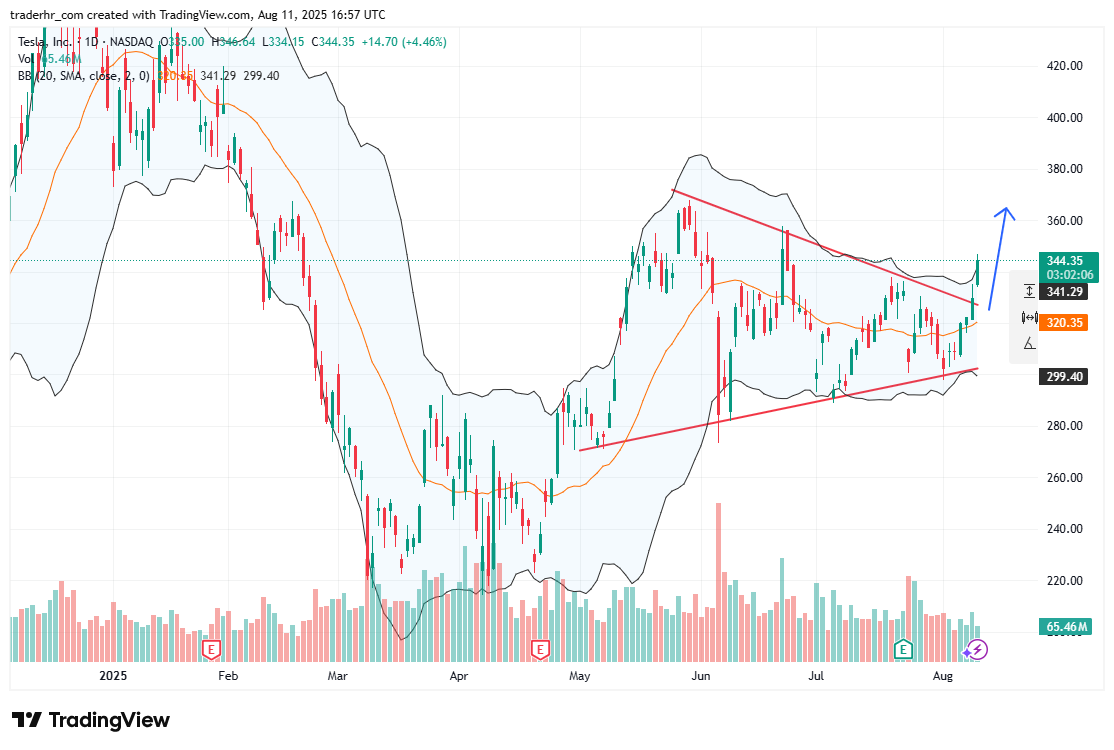
Charts to Watch – TSLA