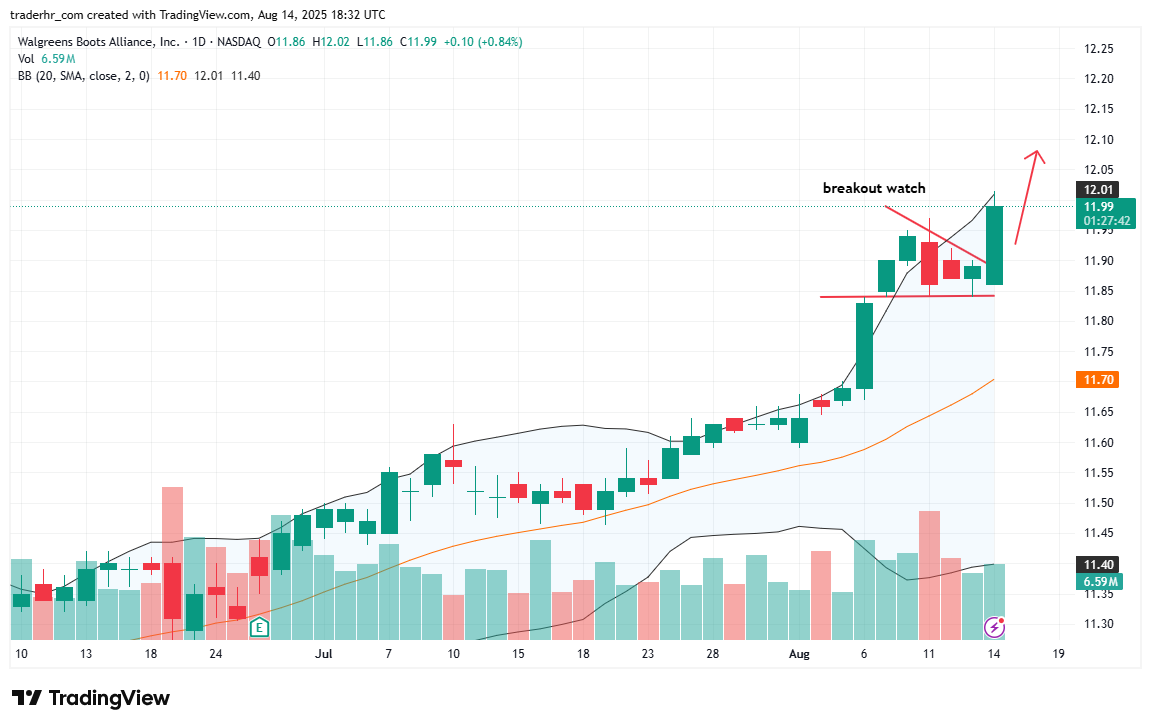
The chart indicates a potential breakout as the stock approaches a resistance level near 12.00. Recent price action shows a series of higher lows, suggesting bullish momentum. The volume appears supportive of this uptrend, and the Bollinger Bands are widening, indicating increased volatility. The 20-day moving average seems to provide a dynamic support level, reinforcing the potential for further upside if the resistance is breached.

Charts To Watch – WBA
