Wynn Resorts displays a recent consolidation breakout, with prices now testing overhead resistance. The Bollinger Bands indicate increased volatility, suggesting potential for further movement. Volume appears to be rising, supporting the current upward momentum. The 20-day moving average is positioned below the price action, which may act as a support level. Traders should monitor the ability of the stock to hold above this breakout level for signs of continued strength.
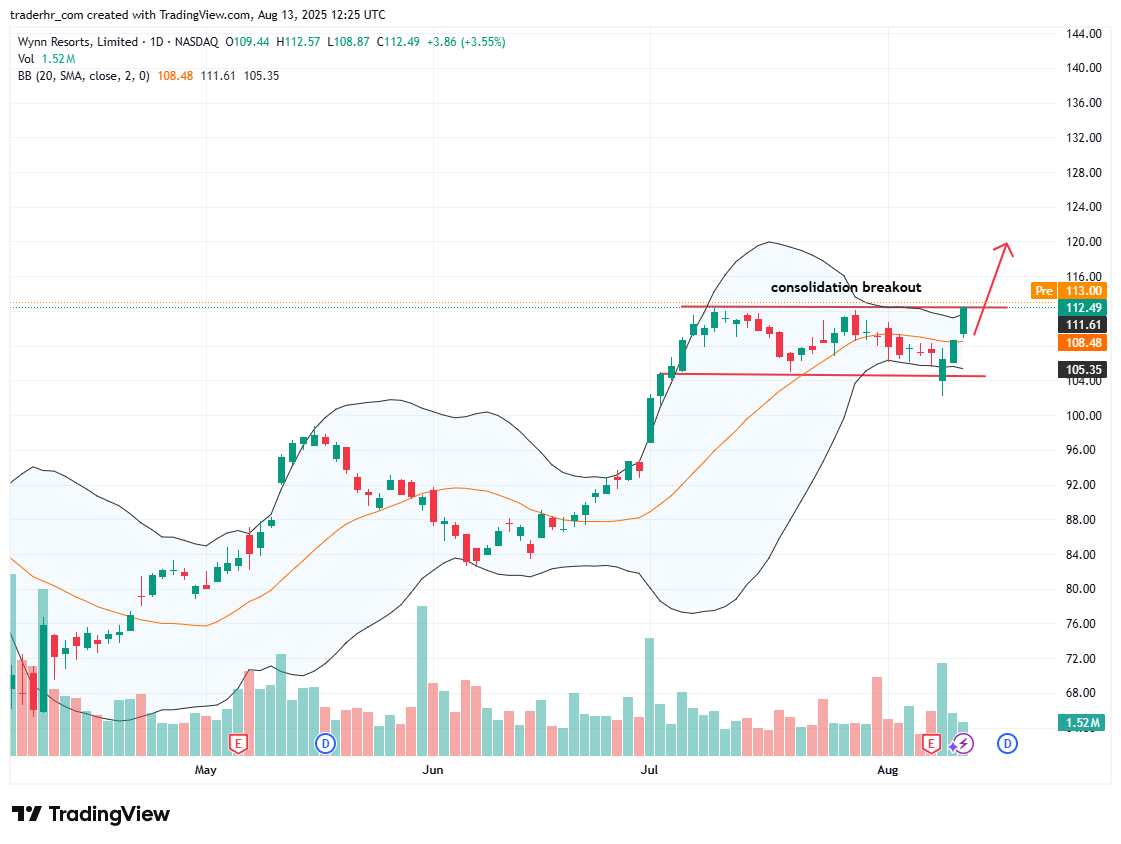
Charts To Watch – WYNN