The chart shows Wynn Resorts consolidating in a narrowing range, evident from the upward sloping trendlines. The recent price action indicates a potential breakout as it approaches the upper trendline. Increased volume accompanying the latest gains suggests heightened interest, while the Bollinger Bands are also tightening, indicating reduced volatility. Momentum indicators appear supportive of upward movement. Observing how the stock reacts at this critical resistance could provide clues for future direction.
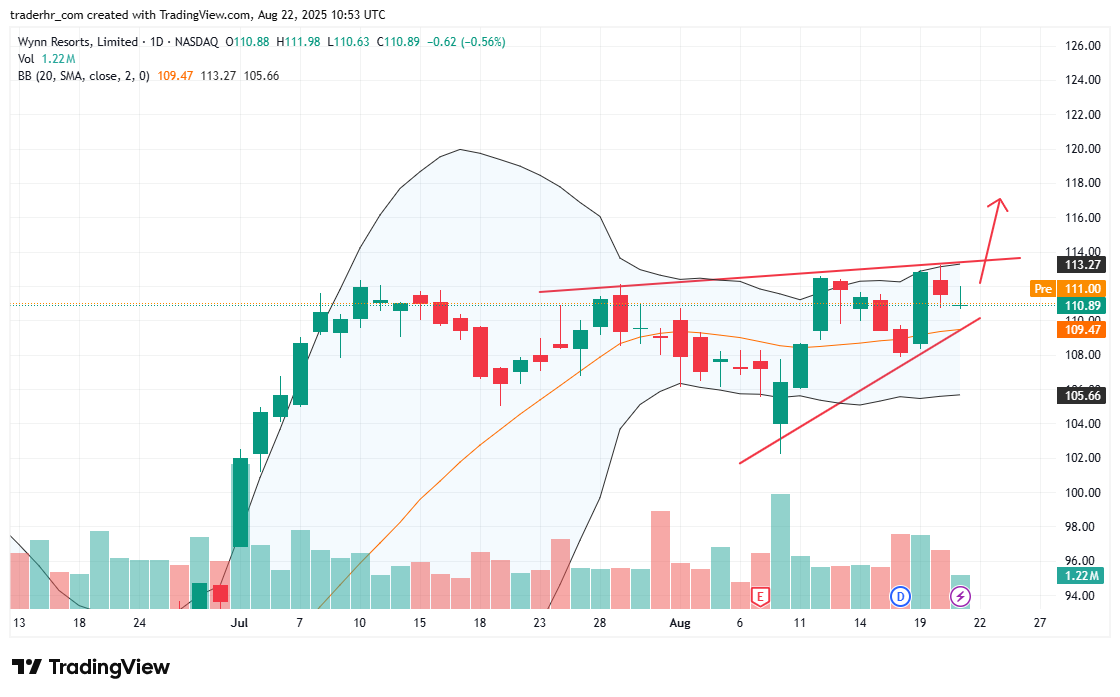
Charts To Watch – WYNN