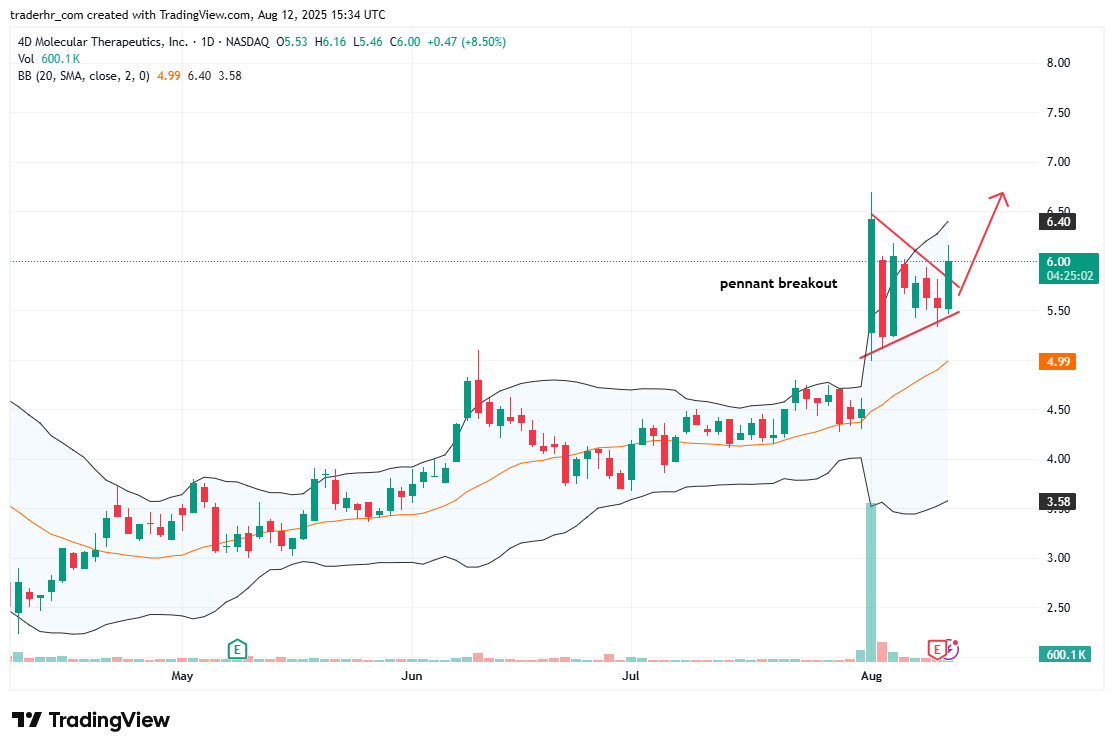
The chart displays a recent pennant formation, indicating potential volatility. A breakout has occurred, suggesting upward momentum may continue as the price approaches prior resistance levels. The Bollinger Bands are tightening, signaling an increase in volatility. Moving averages also show a bullish trend, with the price maintaining above the 20-day SMA. Watch for volume trends as confirmation of sustained price movement.
Charts to Watch – URI